Snmp details screen, Snmp details screen -39 – Verilink WANsuite 5330 (34-00302.F) Product Manual User Manual
Page 67
W e b S e r v e r I n t e r f a c e
3-39
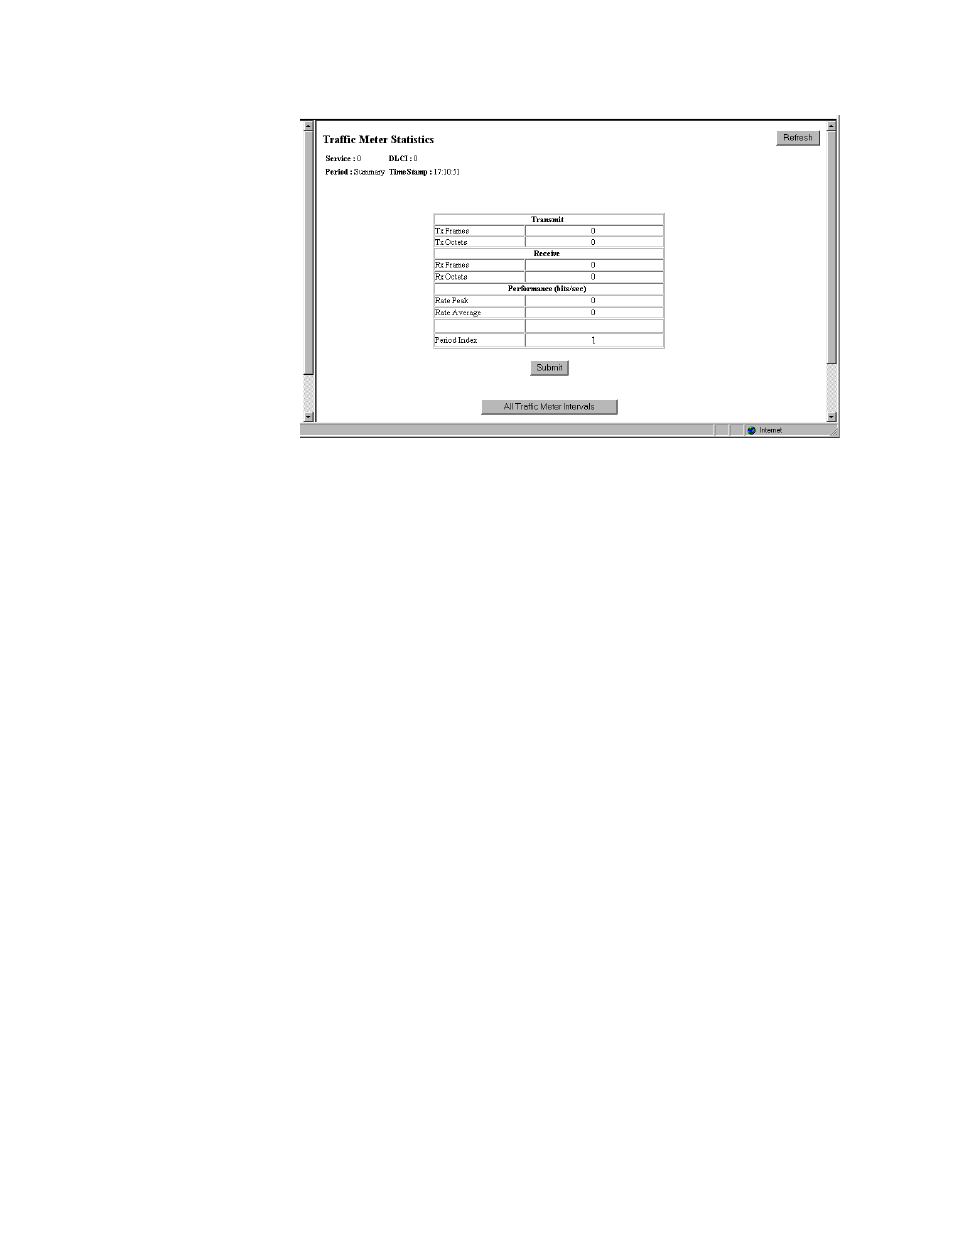
Figure 3.28
Traffic Meter Statistics Screen
The Traffic Meter Statistics screen reports on the following Transmit,
Receive, and Performance parameters:
•
Tx Frames
•
Tx Octets
•
Rx Frames
•
Rx Octets
•
Rate Peak – the peak data rate for the viewed period (see below)
•
Rate Average – the average data rate for the viewed period (see below)
The Period Index field is used to define the period of time for which the
Traffic Meter statistics will be reported. It represents the 24-hour, 15-minute
buckets index. Select a period and then click the “Submit” button to display
the traffic m3eter statistics for that period. The user-selectable options are as
follows:
Summary
Represents the past 24 hours; reports the additive number of frames/octets, the
highest peak encountered for 24 hours, and the average for 24 hours.
Current
Reports on the current 15-minute interval.
Interval 1, Interval 2,
..., Interval 96
Reports on Intervals 1
−
96 that correspond to the periods completed 15
minutes ago, 30 minutes ago, ..., 24 hours ago.
SNMP Details Screen
This screen lets you configure the SNMP parameters described in the
paragraphs below.