Øø:øø:36 type 1, Dur. preamp. range 2ø - 9ø factory setup, Operation – Casella CEL CEL-440 User Manual
Page 43
Operation
Press
Display Shows
Comments
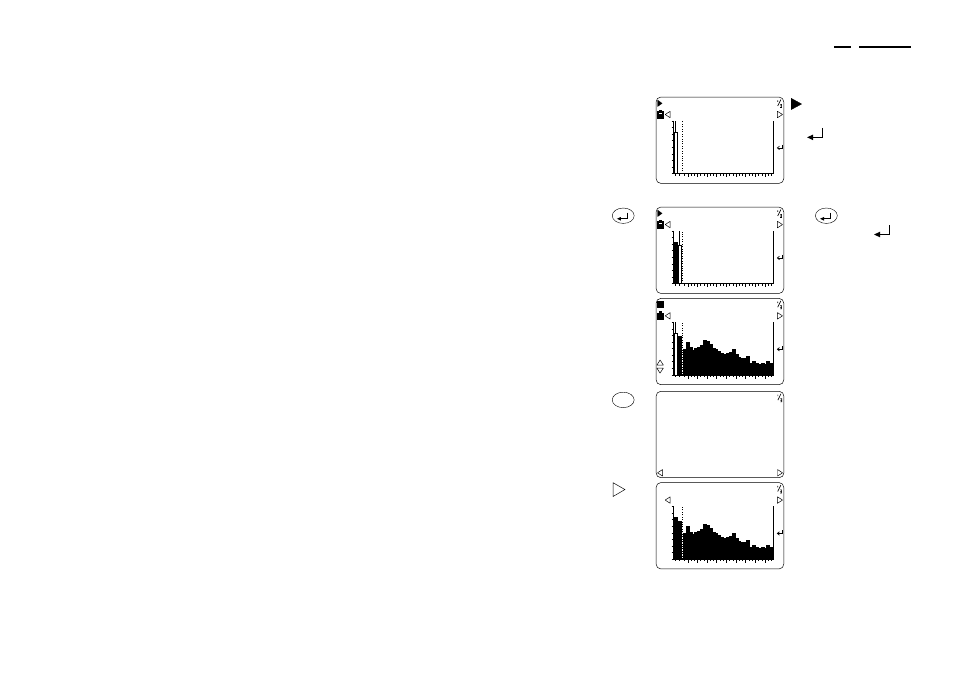
6. When a
screen like
this is
shown
shows that a run is in
progress.
If the cursor does not move
and
is displayed, this
setup must be scanned
manually.
The time elapsed since the
start of the current run is
shown at the top right of the
display.
Continue from Step 7.
7. Scan
through
the
frequency
bands
manually
suf-
ficient
times
Press
to step to the
next band each time
appears on the screen to
indicate that the level in the
current band has stabilised.
8. When all
available
bands have
been
scanned
The instrument stores levels
from all available bands and
leaves the last spectrum on
screen while showing the
current level.
Instruments using firmware
earlier than V2.0 return
automatically to the Stop
screen.
9. Inspect
data stored
during the
current
narrowband
run
A data header screen for the
most recently saved run will
be displayed.
It indicates the time elapsed
since the start of the run
(duration), bandwidth,
preamplifier type, range and
setup in use.
10. Inspect
further
stored data
This screen shows the
spectrum saved for the first
measurement parameter (in
this example L
Z1
).
Z
I
Z
73.6
8k
2k
500
125
32
20
40
60
80
L
m-16
dB
Ø:1Ø
A
Z
Z
I
A
68.3
8k
2k
500
125
32
20
40
60
80
L
m-17
dB
Ø:17
A
Z
Z
I
Z
73.6
8k
2k
500
125
32
20
40
60
80
L
m-24
dB
A
Z
DATA
ØØ:ØØ:36
Type 1
m-18
Dur.
Preamp.
Range 2Ø - 9Ø
Factory Setup
Z
I
8k
2k
500
125
32
20
40
60
80
L
m-19
A
Z
1Ø:32:2Ø
CEL-440/480 Operators Handbook - Page 43
Operation