Basler Electric BE1-87T User Manual
Page 137
9171300990 Rev V
BE1-87T Setting Notes
A-9
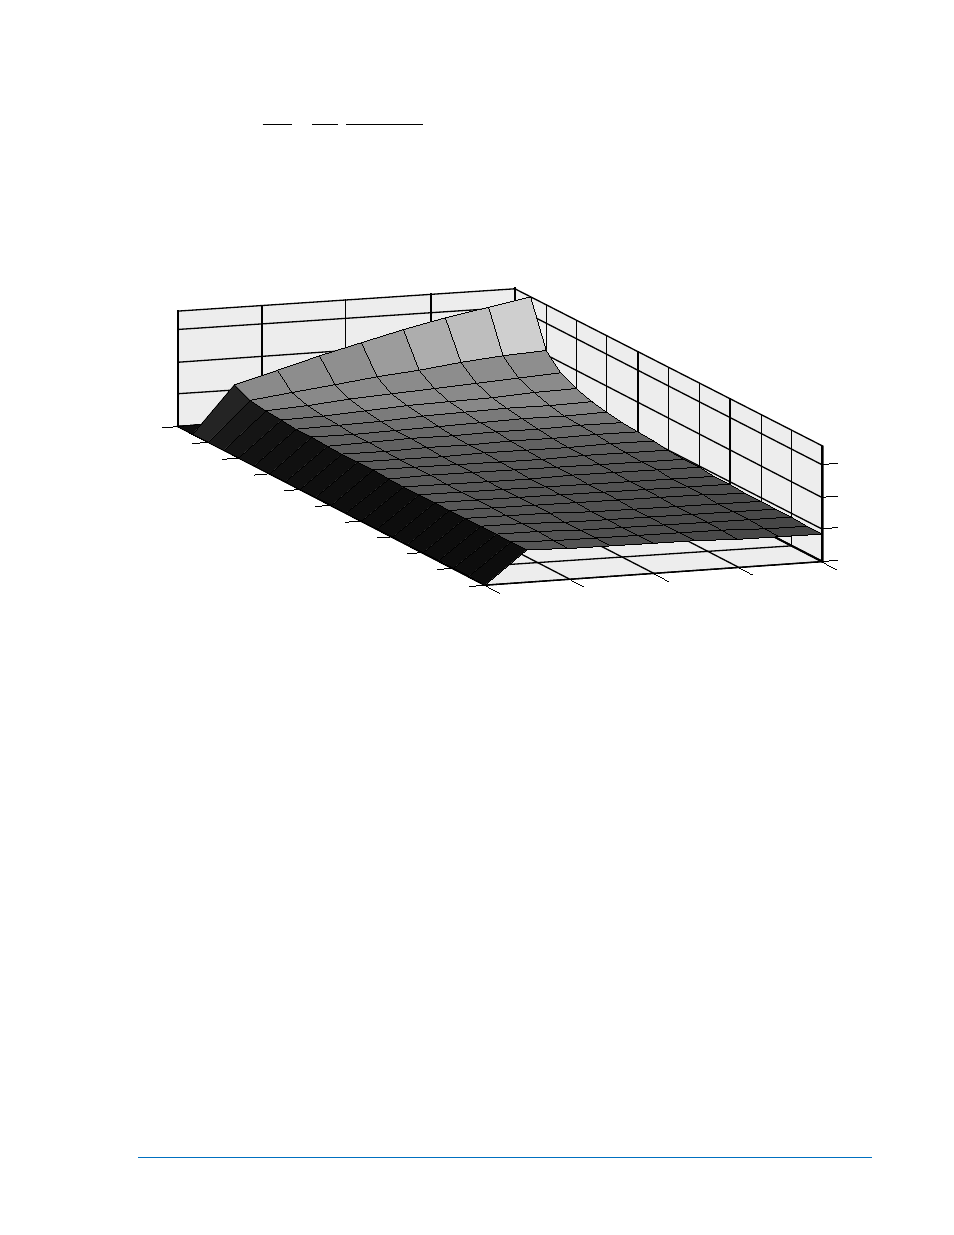
To compare the two expressions, we take the ratio SF`/SF:
Since this expression varies with the ratio of the actual relay circuit burden (ZB) to the accuracy class
burden (Zc) and the CT internal resistance (Rs), it is best visualized with a surface plot showing
simultaneous variations of the parameters. The following example is based on a C200 (Zc=2) with Rs
varying from 0.1 to 0.8 ohms and ZB varying from 0.1 to 2 times ZC ohms. (Load angles are neglected).
Figure A-9. SF`/SF Ratio
The 0 to 20 axis represents the variations X10 of ZB (20 is 2xZC). The 0 to 8 axis represents the variations
x10 of Rs in ohms. The vertical axis (0 to 4) shows that for ZB values equal to or greater than the burden
value Zc, the two saturation factor equations are nearly identical. The ANSI Accuracy Class method yields
the larger, more conservative result. For low values of ZB and large values of Rs, the Excitation Curve
method yields a larger saturation factor. Since the Excitation Curve method is closely following the CT
characteristics, it may be said that the ANSI Class method which neglects the CT internal resistance, is
too optimistic in this range and should be discarded in favor of the Excitation Curve method. The absolute
values of SF and SF` are compared in Figure A-10 for the particular case where Zc=2, ZB=0.5 and Rs=0.8
when IF varies from 0 to 100A.
)
(
)
(
.
`
Rs
Zc
Rs
ZB
ZB
Zc
SF
SF
+
+
=
0
2
4
6
8
0
2
4
6
8
10
12
14
16
18
20
0
1
2
3