Super Systems SD Recorder II User Manual
Page 21
Super Systems Inc.
Page 21 of 50
SD Recorder II Operations Manual
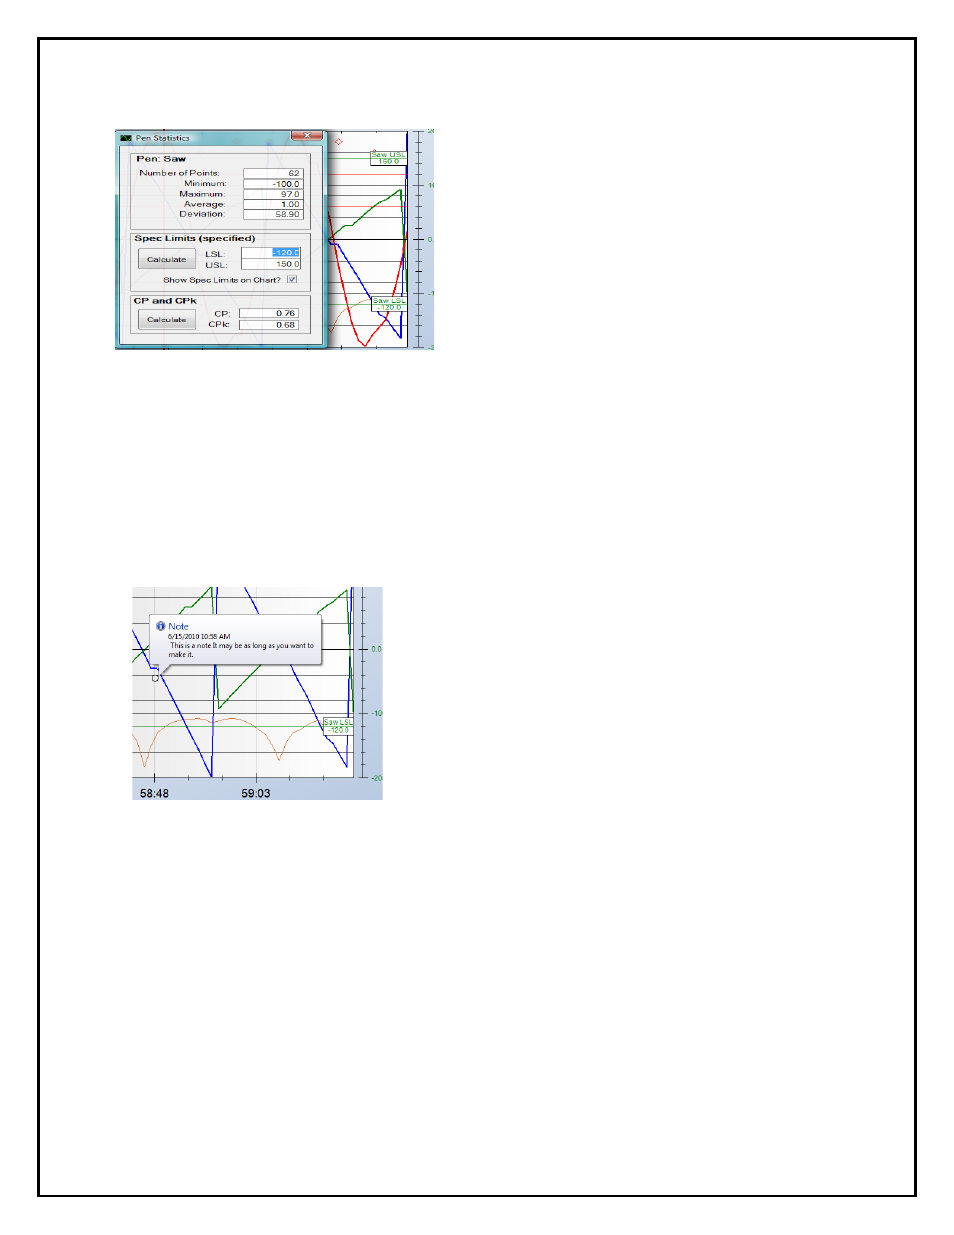
Statistics – Clicking this item will display the
“Pen Statistics” dialog for this pen. This dialog
will display the number of points for this pen in
the plot area. For those points, the minimum,
maximum, average and standard deviation are
calculated and displayed.
Spec Limits – spec limits are normally
specified by some engineering criteria. Lower
Spec Limits (LSL) and Upper Spec Limits (USL)
may be entered here and may be displayed on the chart by checking the checkbox. The
“Calculate” button will calculate limits that will result in CP and CPk of 1.0.
CP and CPk – When Spec Limits are entered, clicking “Calculate” will display values of
CP and CPk based on Spec Limits and the data in the current plot area.
Notes in the Plot Area – Notes are displayed as
points in the Plot Area. Note points are black circles.
When hovering the mouse pointer on or near the
point, the note information will be displayed.
Zooming in the Plot Area – You may zoom in on an area in the plot area by holding
the left mouse button down while dragging the mouse. The zoomed in area will be
outlined. The plot area will be zoomed in on as soon as the mouse button is released. If
the Chart is in RealTime mode it will change to Historical mode as soon as the chart is
zoomed. Zooming limits are enforced at about 0.1% of vertical scale and horizontally
at about 5 point intervals.