Error detection, Error detection -8, Figure 6-9 viperview, error conditions – Comtech EF Data VMS v3.12.x Vipersat User Manual
Page 314
ViperView—Monitor and Control
MN/22156, rev 12
6-8
VMS User Guide
Error Detection
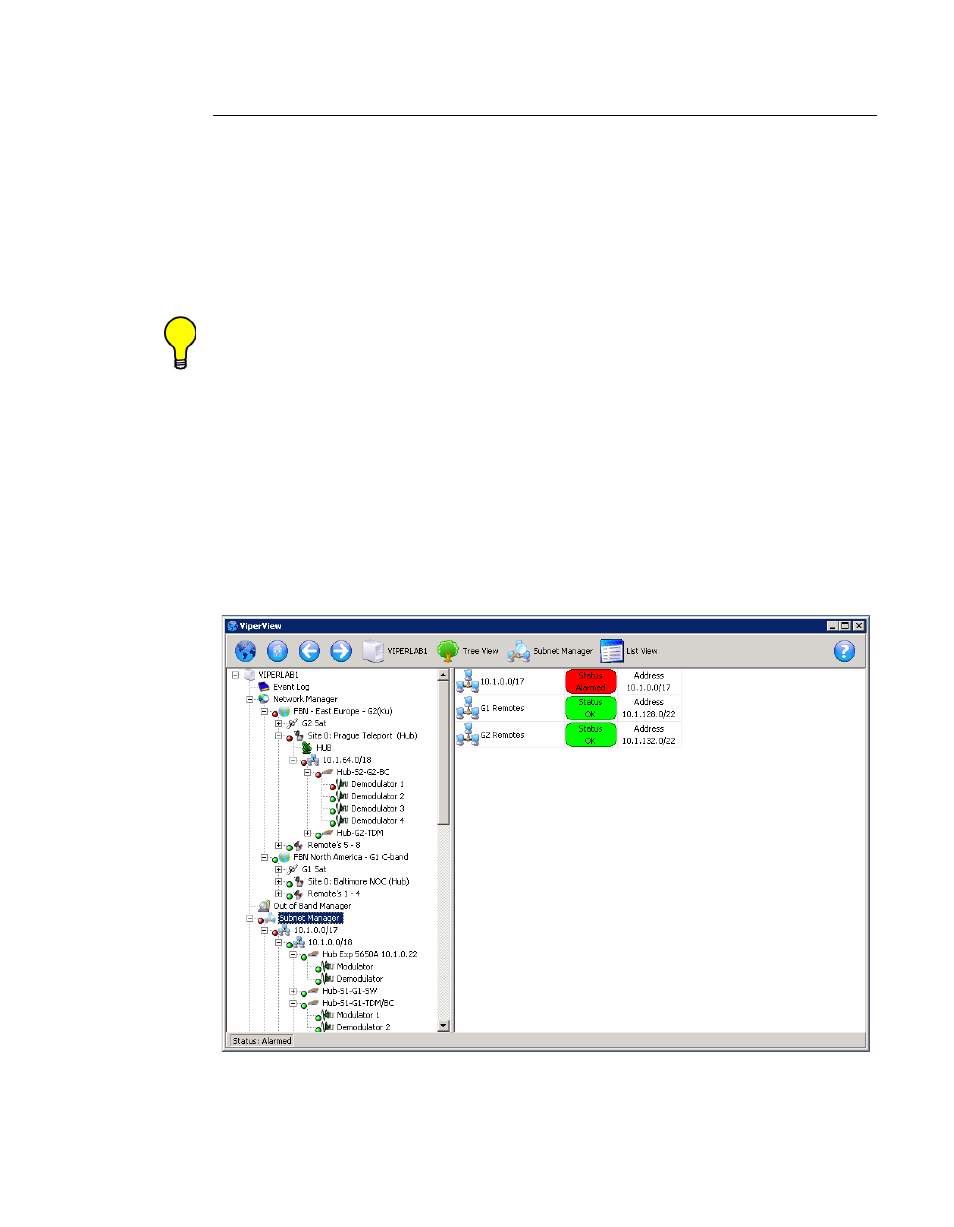
Using the ViperView screen, you can quickly see which sites in the network are
showing an error condition and which have all of the equipment and software
operating normally.
Green is used, as shown in figure 6-9, to show which sites, links, and equipment
are operating normally. Red, on both the right window panel and for devices in
the tree view in the left panel, indicates that there is an alarm condition. Gray
indicates that the status is unknown—no multicast (PLDM) is being received.
Tip: The red error condition indicator associated with a site indicates that at
least one of the devices in a site is reporting an alarm condition for a link.
Utilizing the many display options of ViperView, the entire Vipersat network
can be quickly and easily scanned to determine the condition of each of the
components in the network.
At the main screen level, there are a number of choices to examine, isolate, and
remedy the error conditions. The tools available are easily reached from the
ViperView display. In figure 6-9, the presence of alarms can be seen reflected in
both the Network Manager service as well as the Subnet Manager service
(selected in the figure).
Figure 6-9 ViperView, Error Conditions