Application traffic trend, Individual application reports – H3C Technologies H3C Intelligent Management Center User Manual
Page 104
94
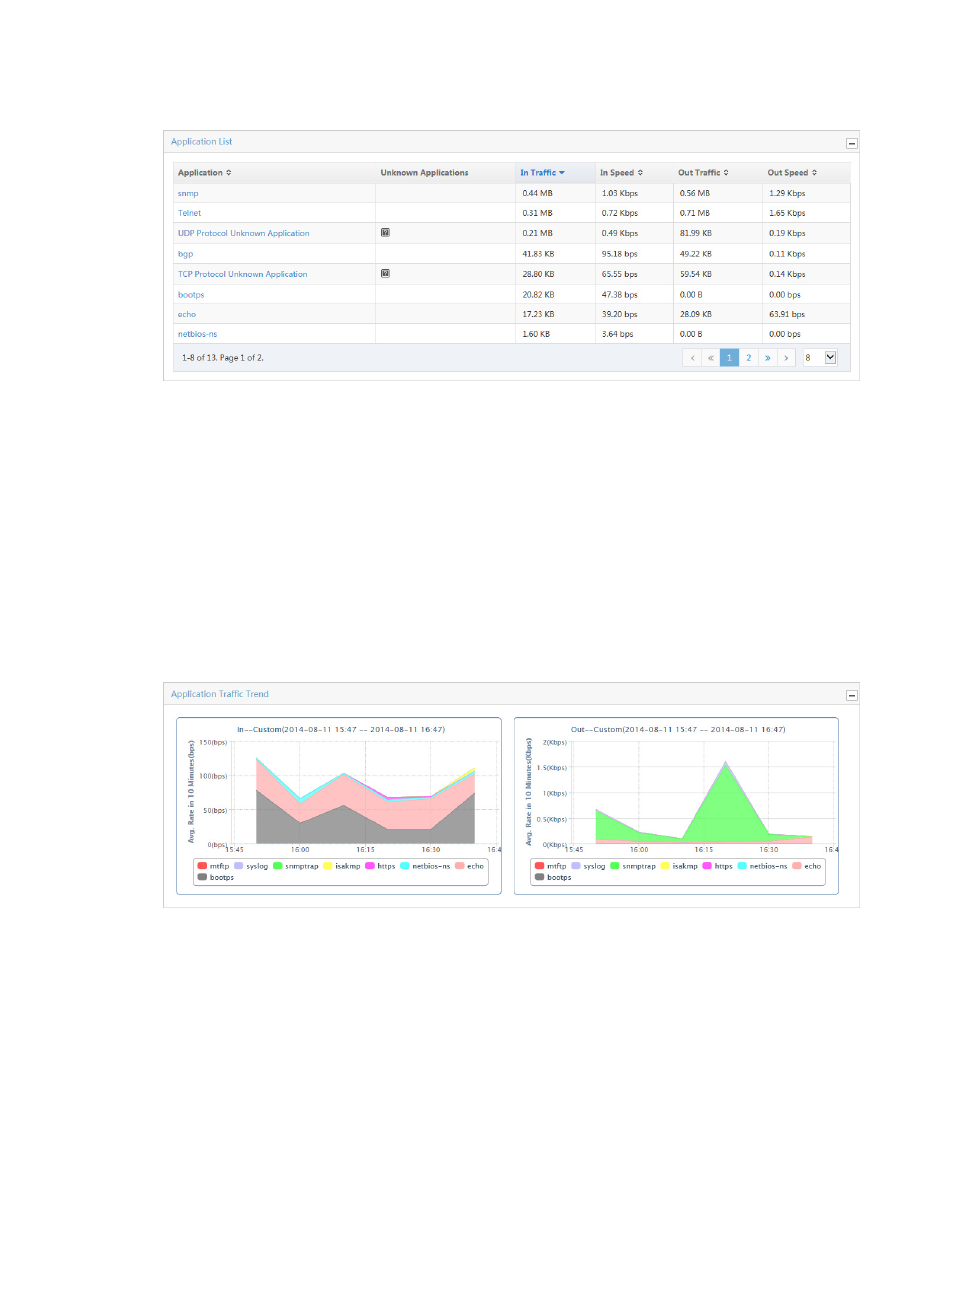
Figure 18 Application Report: Application List
Select 8, 15, 50, 100, or 200 on the lower right side of the main pane to configure how many items per
page you want to view.
Click the name link for an application to view the report for the application. For more information about
the report for each individual application, see "
Individual application reports
."
Application traffic trend
The Application Traffic Trend – In/Out stacked area chart provides average inbound/outbound traffic
rates for all applications observed for all interfaces in the selected traffic analysis task or for an interface
in a task for the selected time range. If there is more than one interface for the selected task, these
statistics reflects traffic for all interfaces configured in a task.
Figure 19 Application Report: Application Traffic Trend - In/Out
Individual application reports
NTA provides traffic trend statistics for the individual applications that were observed on the interfaces
for a selected task. Individual application reports have the Application Traffic Information report that
displays the average rate of traffic for the selected application and a source and destination host list that
identifies which source and destinations contributed the greatest volume of traffic for the selected
application.
Individual application reports also have the TopN Application Usage List for source and destination hosts,
and reports for unknown TCP and UDP applications.
Unknown applications are those applications for which the Layer 4 TCP or UDP port number has not
been assigned a name and is not included as an application in NTA. For more information about