Traffic trend - average, Traffic trend - peak rate – H3C Technologies H3C Intelligent Management Center User Manual
Page 337
327
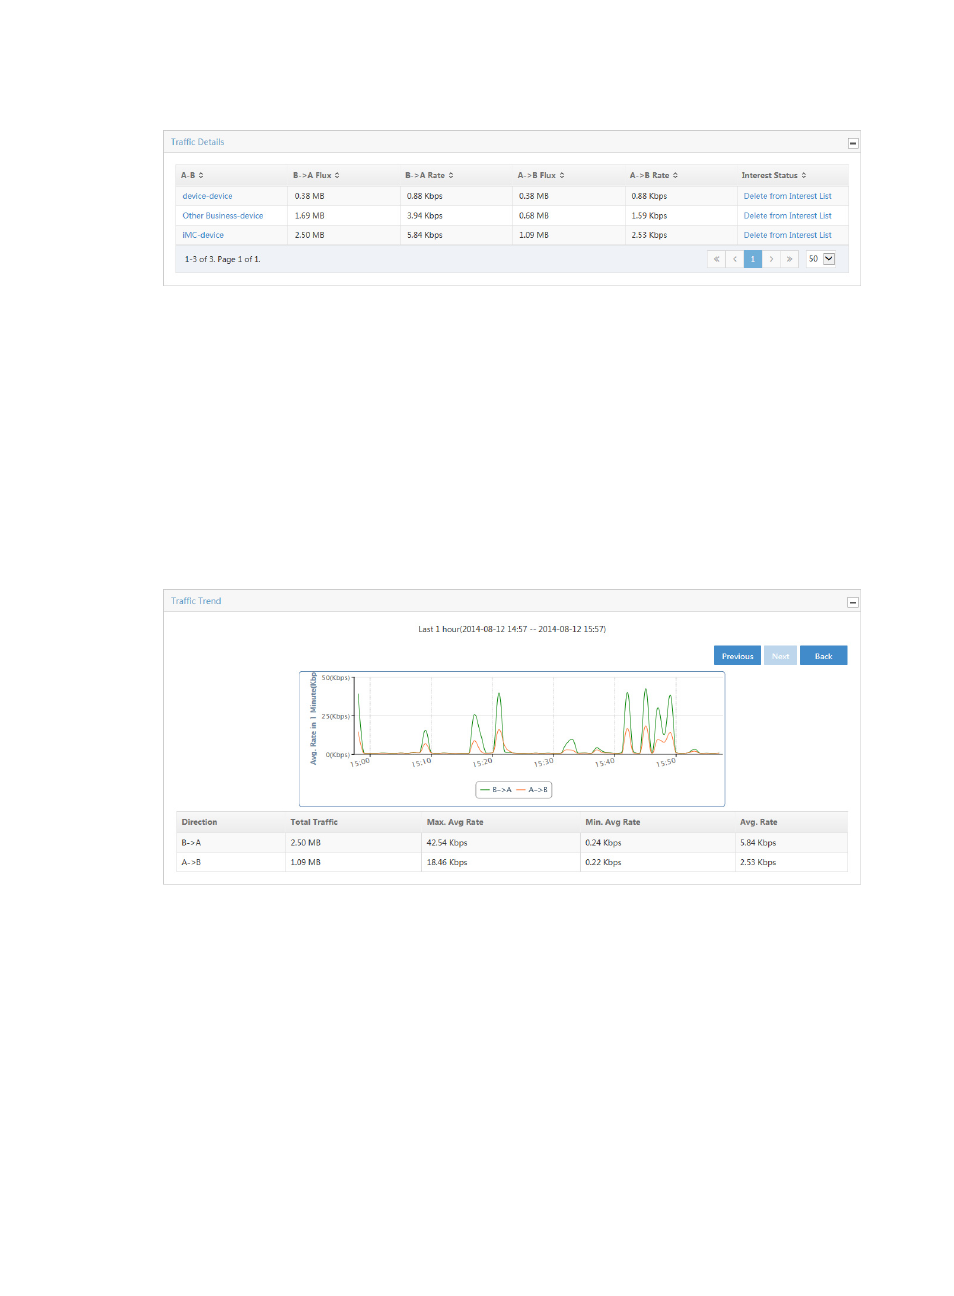
Figure 224 Inter-Business Report: Traffic Details List
To add a bidirectional pair to the Interest List, click the Add to Interest List link for the associated
bidirectional pair you want to add.
Traffic trend - average
The Traffic Trend chart provides you with the average rate of traffic for the inter-business in the associated
task. This chart also provides average, minimum average, maximum average, and total traffic volume
statistics in a tabular format for inter-business in the associated task. By default, the Traffic Trend chart
displays statistics for the previous hour.
•
To view data for an earlier period, click the Previous button in the upper right corner of the chart.
•
To view data for a later period, click the Next button in the upper right corner of the chart.
Figure 225 Inter-Business Report: Traffic Trend Reports
To view this report for an inter-business traffic in a task, click the bar in the TopN Avg. Rate chart report
for the inter-business for which you want to view reports.
Traffic trend - peak rate
If you have enabled the Peak Traffic Analysis feature, and you have selected a time range from the Query
Time list of the Query Traffic area that is at least 6 hours earlier than the current time, NTA displays the
Max./Min. Peak Rate chart to the right of the Traffic Trend chart.
The Traffic Trend – Peak Rate line chart displays, for the selected time range, the minimum and maximum
inbound and outbound peak traffic rates for the associated task. This chart contains four lines: Max. In
Peak Rate, Min. In Peak Rate, Max. Out Peak Rate, and Min. Out Peak Rate.