Traffic trend - peak rate, Traffic details – H3C Technologies H3C Intelligent Management Center User Manual
Page 177
167
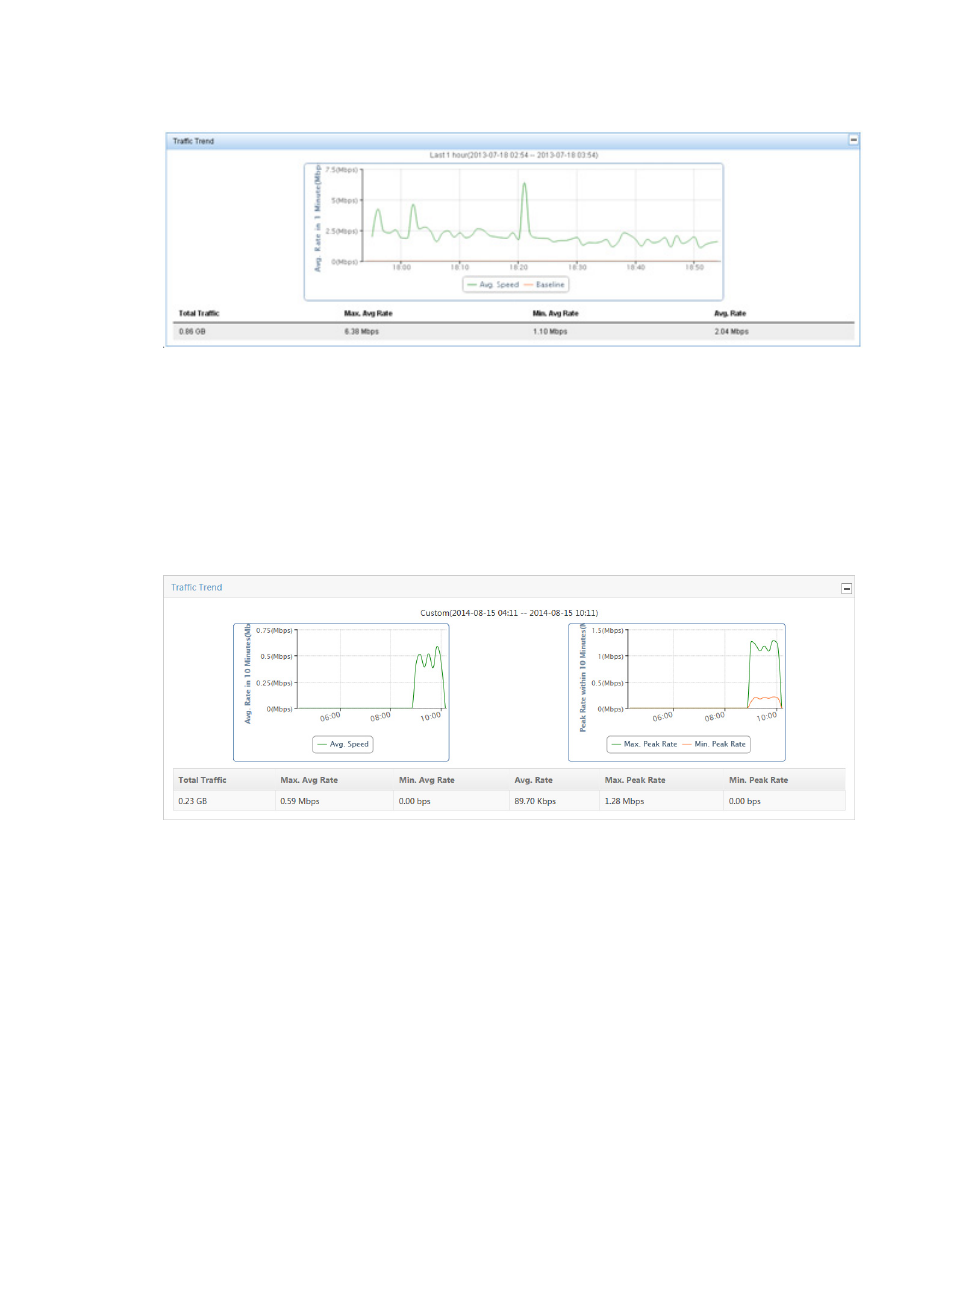
Figure 92 Traffic Report: Traffic Trend
Traffic trend - peak rate
NTA displays the Max./Min. Peak Rate chart to the right of the Traffic Trend chart when the Peak Traffic
Analysis feature is enabled and the time range for the report exceeds 6 hours.
The Traffic Trend – Peak Rate line chart displays the minimum and maximum peak traffic rate for the
associated task for the selected time range. This chart contains two lines. The red line displays the
maximum peak rate. The green line displays the MIN peak rate.
Figure 93 Traffic Report: Traffic Trend – Peak Rate Report
For more information on enabling Peak Traffic Analysis, see "
Configuring NTA traffic analysis
."
Traffic details
The Traffic Details list provides the data collection samples for traffic statistics based on the report time
range. This report includes timestamp, total volume of traffic and traffic rate in seconds.