Dashboard widgets, Configuring the dashboard display, Figure 231 – H3C Technologies H3C Intelligent Management Center User Manual
Page 357
347
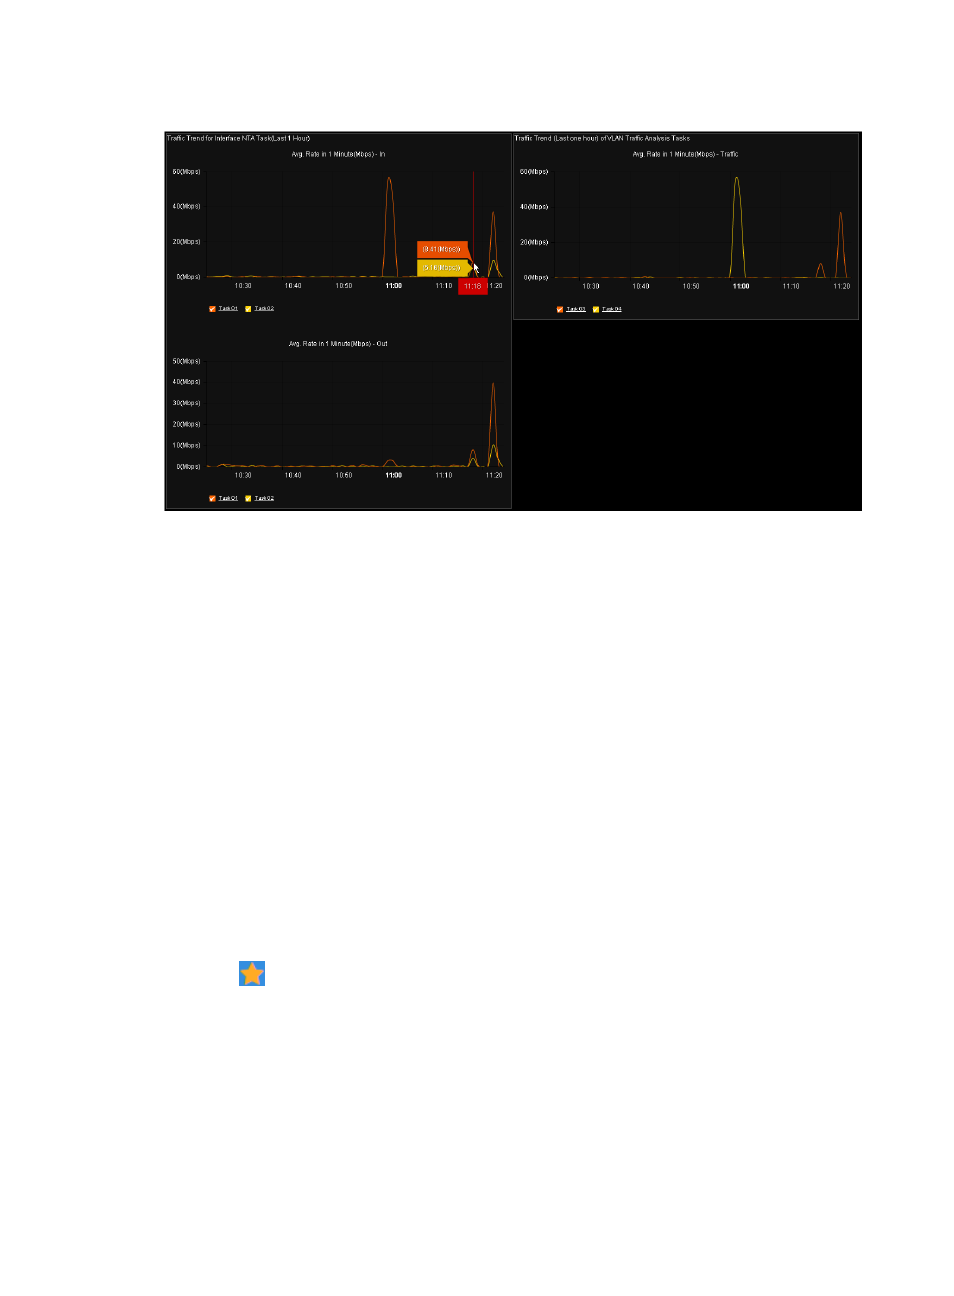
Figure 231 Display tiling
Move the mouse pointer to the curves to see the specific values.
Dashboard widgets
Dashboard widgets provided by NTA include:
•
Traffic Trend for Interface NTA Task (Last 1 Hour)
•
Traffic Trend for VLAN NTA Task (Last 1 Hour)
•
Traffic Trend for Probe NTA Task (Last 1 Hour)
•
Traffic Trend for Application NTA Task (Last 1 Hour)
•
Traffic Trend for Host NTA Task (Last 1 Hour)
•
Traffic Trend for VPN NTA Task (Last 1 Hour)
To view widgets by using the dashboard widgets function, the administrator should configure the display
content and layout of the dashboard widgets first.
Configuring the dashboard display
1.
Click
on the top navigation bar.
2.
Select Dashboard > Configuration from the menu to open the dashboard configuration page, as
shown in
.