Topn traffic list for destination host – H3C Technologies H3C Intelligent Management Center User Manual
Page 122
112
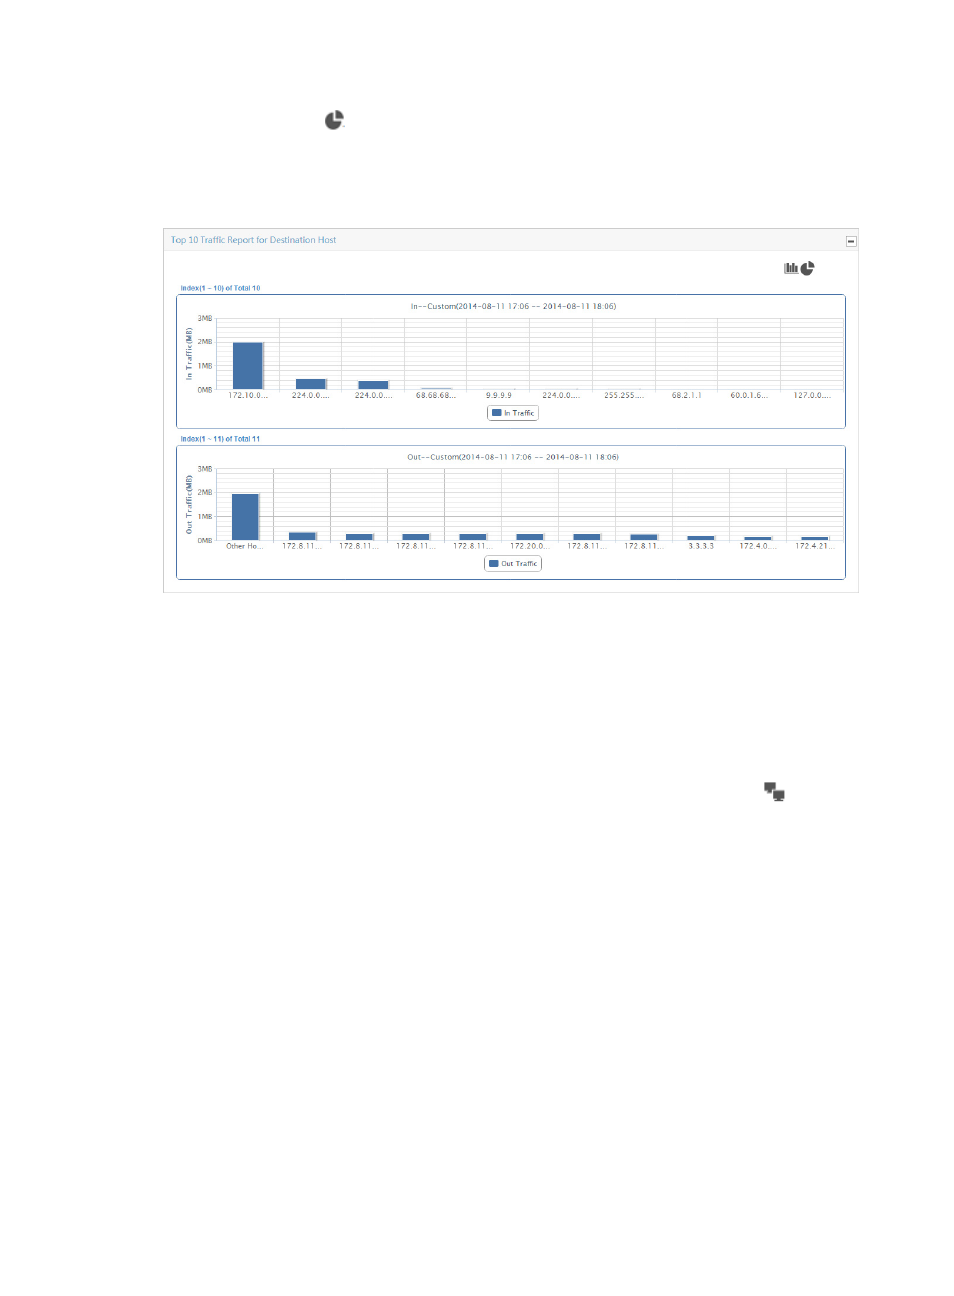
Click the pie chart icon
to change the bar chart to a pie chart. The pie chart displays the distribution
of inbound/outbound traffic of TopN destination hosts on all interfaces in the selected traffic analysis
task for the selected time range. Each slice of the pie chart is a link to traffic reports for the selected
destination host.
Figure 38 Destination Report: TopN Traffic Report for Destination Host - In/Out
TopN traffic list for destination host
The TopN Traffic List for Destination Host – In/Out provides a list of the TopN destination hosts measured
by volume of inbound/outbound traffic observed on all interfaces in the selected interface traffic analysis
task for the selected time range. This list has the destination IP address, total volume of traffic generated
by the associated destination Interface, rate of traffic, and the percentage of all observed traffic
generated by the destination Interface.
The IP address is a link to reports for the selected destination host. The host query icon
next to the
Destination IP address is a link for initiating a destination host query and a link to the results of the query.