Traffic trend - peak rate – H3C Technologies H3C Intelligent Management Center User Manual
Page 249
239
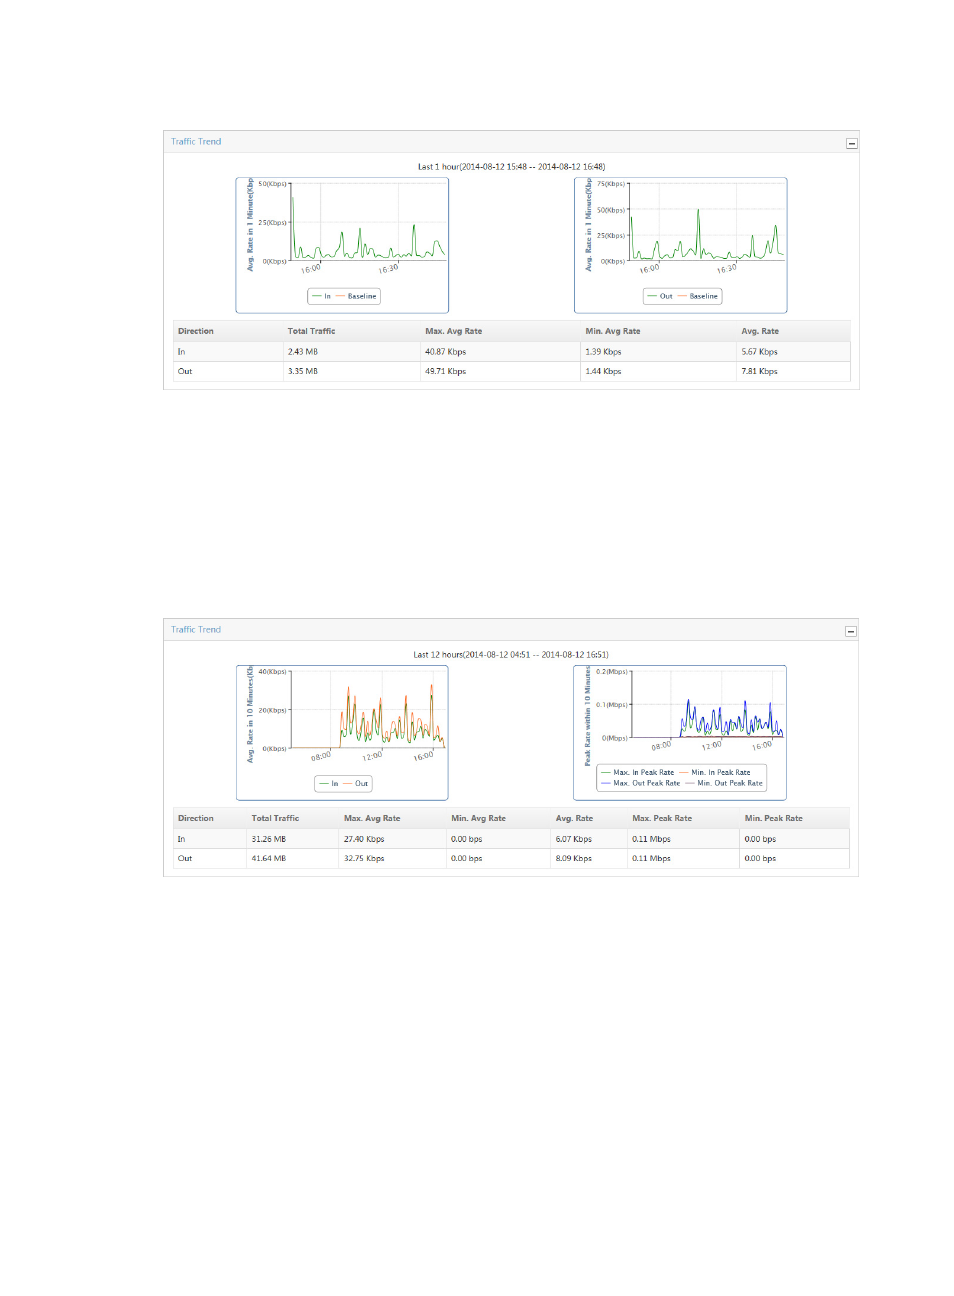
Figure 145 Traffic Report: Traffic Trend Report
Traffic trend - peak rate
NTA displays the Max./Min. Peak Rate chart to the right of the Traffic Trend chart when the Peak Traffic
Analysis feature is enabled and the time range for the report exceeds 6 hours.
The Traffic Trend – Peak Rate line chart displays the minimum and maximum peak traffic rate for the
associated task for the selected time range for both inbound and outbound traffic. This chart contains
four lines, Max. In Peak Rate, Min. In Peak Rate, Max. Out Peak Rate, and Min. Out Peak Rate.
Figure 146 Traffic Report: Traffic Trend – Peak Rate Report
If the Baseline Analysis feature is enabled for the selected traffic analysis task, the Traffic Trend
combination line chart shows two charts: inbound Traffic Trend and outbound Traffic Trend. NTA shows
the Max./Min. In Peak Rate chart and the Max./Min. Out Peak Rate chart under the Traffic Trend chart.
For more information about configuring the Baseline Analysis feature for the host traffic analysis task, see
"
Configuring NTA traffic analysis parameters
."