Application traffic trend, Topn application usage list – H3C Technologies H3C Intelligent Management Center User Manual
Page 105
95
assigning names to TCP or UDP ports and adding them as applications to NTA, see "
To view individual application reports for an interface task or for a single interface in an interface task,
click the name in the Application field of the Application List report for the application for which you want
to view this report.
To view unknown application reports for an interface task or for a single interface in an interface task,
click the icon
in the Application field of the Application List report for the application for which you
want to view this report.
For more information about Application List, see "
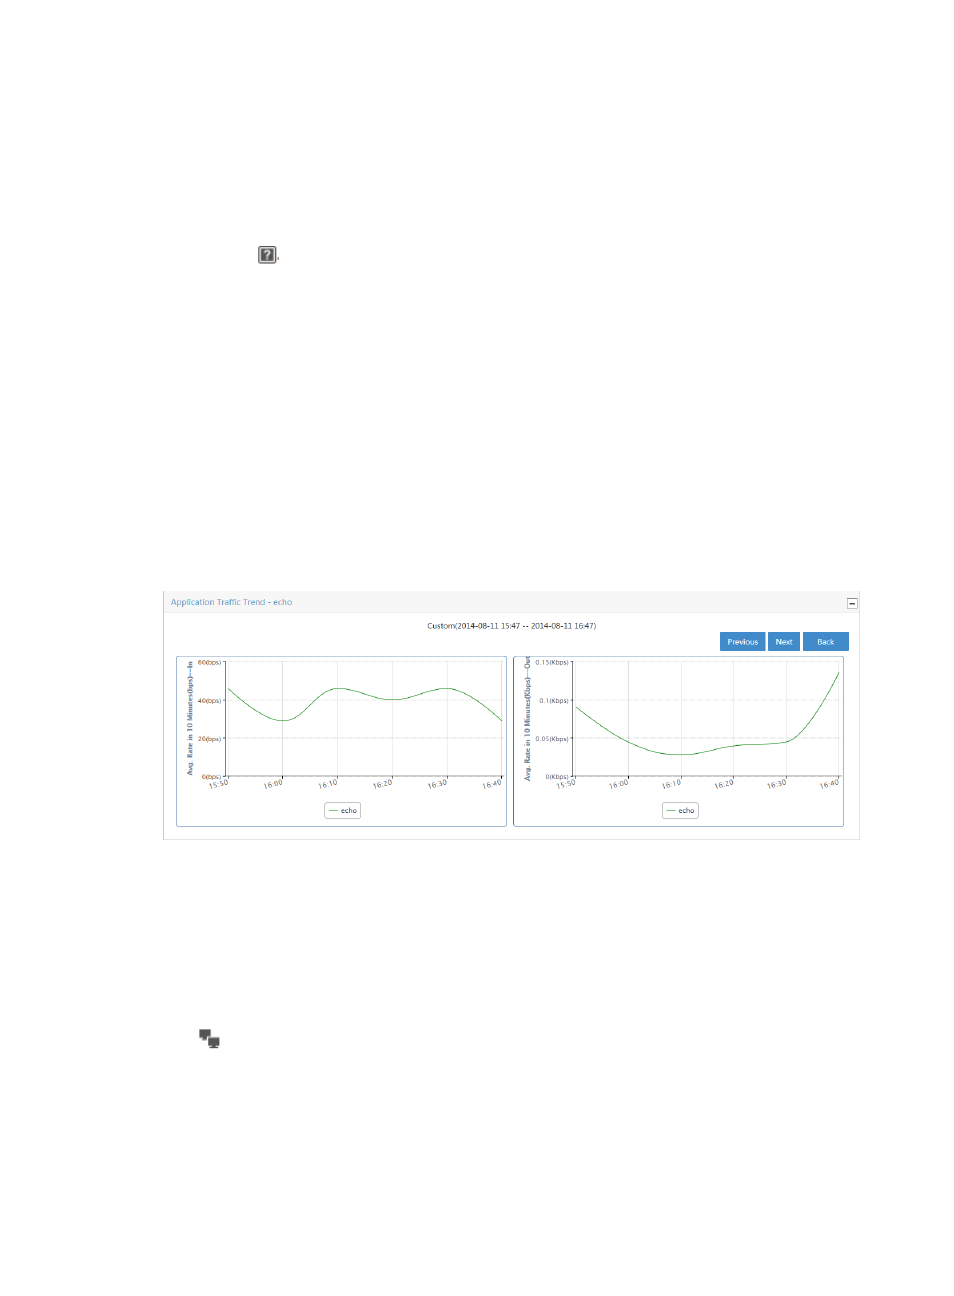
Application traffic trend
The Application Traffic Trend graph provides average rate of traffic for an individual application for all
interfaces in the selected traffic analysis task or for an individual interface in a task. If there is more than
one interface for the selected task, this chart reflects traffic for all interfaces configured in a task.
By default, the Traffic Trend Report graph displays statistics for the previous hour.
1.
In the upper right corner of the chart, click the Previous button to view data for an earlier period.
2.
In the upper right corner of the chart, click the Next button to view data for a later period.
Click Back to return to the main Application report page.
Figure 20 Application Report: Traffic Trend for an Individual Application
TopN application usage list
The TopN application usage list includes Source Host List - In/Out and Destination Host List - In/Out lists.
The Source Host List - In/Out provides you with a list of the TopN source hosts measured by volume of
traffic observed on all interfaces in the selected interface traffic analysis task or for an interface in a task
for the selected time range. This list includes the source host IP address, total volume of traffic for the
associated source, and the percentage of all observed traffic generated by the source. The host query
icon
next to the Source Host IP Address is a link for initiating a host query and a link to the results
of the query.
The Destination Host List – In/Out provides you with a list of the TopN destination hosts measured by
volume of traffic observed on all interfaces in the selected interface traffic analysis task or for an interface
in a task for the selected time range. This list includes the destination IP address, total volume of traffic for
the associated destination, and the percentage of all observed traffic generated by the destination. The