Vpn flux distribution in interfaces, Interface flux distribution in vpns, Summary list (last 1 hour) – H3C Technologies H3C Intelligent Management Center User Manual
Page 288
278
The Choose NTA Task dialog box appears.
2.
Select the check box next to the host task for which you want to view this report.
3.
Click OK.
The page displays the Traffic Trend – In, Traffic Trend – Out, TopN Application – In, and TopN
Application – Out reports for the selected task.
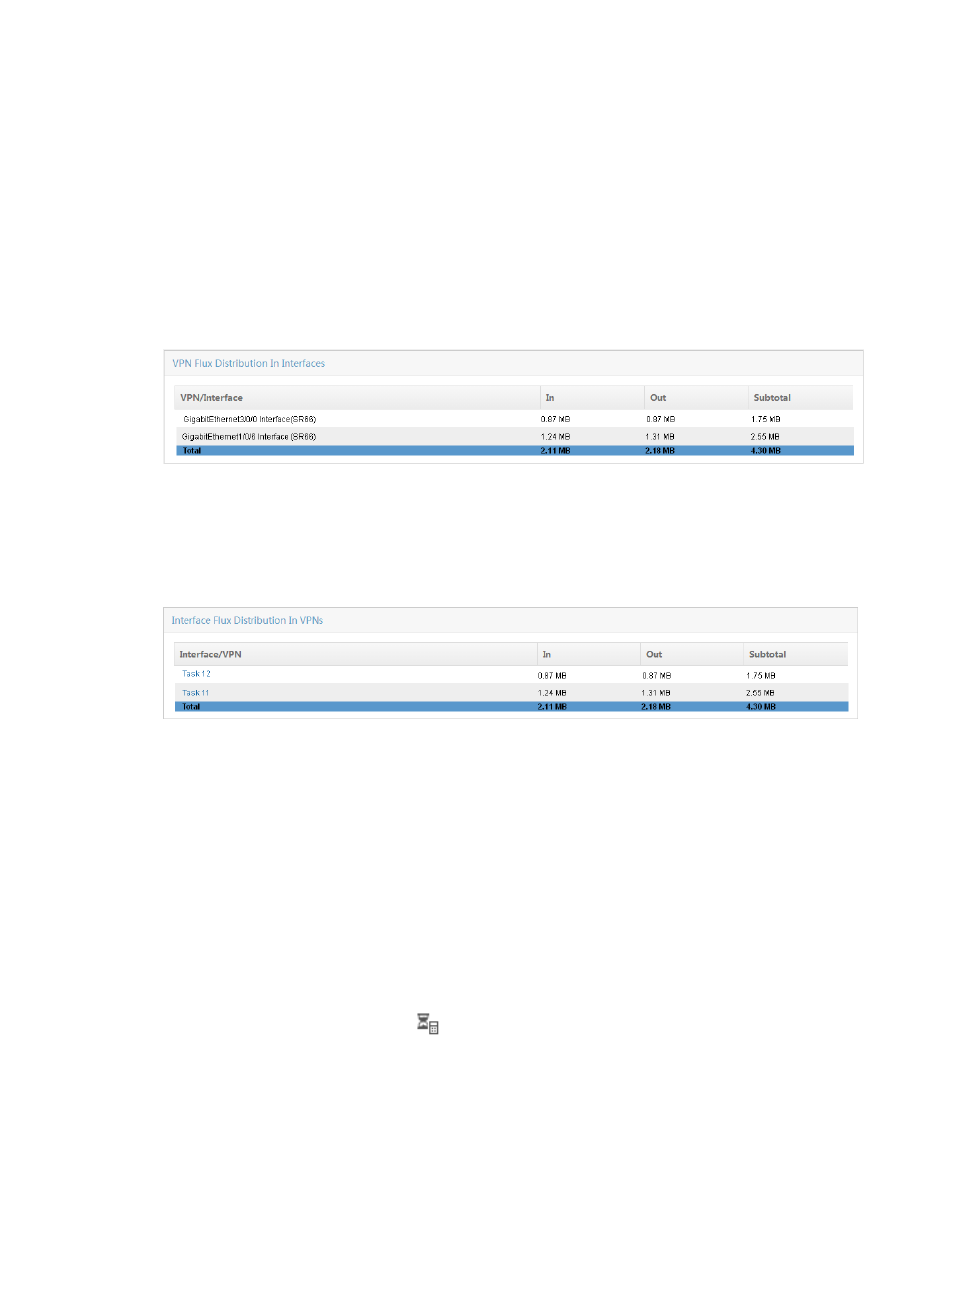
VPN flux distribution in interfaces
The VPN Flux Distribution In Interfaces table provides the total volume of inbound and outbound traffic
for all interfaces in all VPNs.
Figure 181 Summary Report: VPN Flux Distribution in Interfaces
Interface flux distribution in VPNs
The Interface Flux Distribution In VPNs table provides the total volume of inbound and outbound traffic
for all VPNs grouped by interface.
Figure 182 Summary Report: VPN Flux Distribution in VPNs
Summary list (last 1 hour)
The Summary List provides inbound and outbound traffic rates statistics summarized by VPN task for the
last hour.
Summary List Contents
•
Task Name—Contains the name of the VPN traffic analysis task. The contents of this field link to
reports for associated task.
•
Total Rate—Provides the combined inbound and outbound traffic for all VPNs configured for the
associated task.
•
In Rate—Provides the rate of inbound traffic for all VPNs configured for the associated task.
•
Out Rate—Provides the rate of outbound traffic for all VPNs configured for the associated task.
•
Traffic Log Audit—Contains the
Traffic Log Audit icon. The icon is a link to the Traffic Log Audit
result page.
1.
The Add button at the top of the Summary List provides a shortcut to the Add Traffic Analysis Task
page. For more information on adding VPN traffic analysis tasks, see "
2.
Click the Refresh button to update the reports with the most recent data.