Octave, Graph – Casella CEL CEL-63X User Manual
Page 28

CEL-63x Environmental & Occupational Noise Meter
28
Casella CEL
Octave and 1/3-Octaves
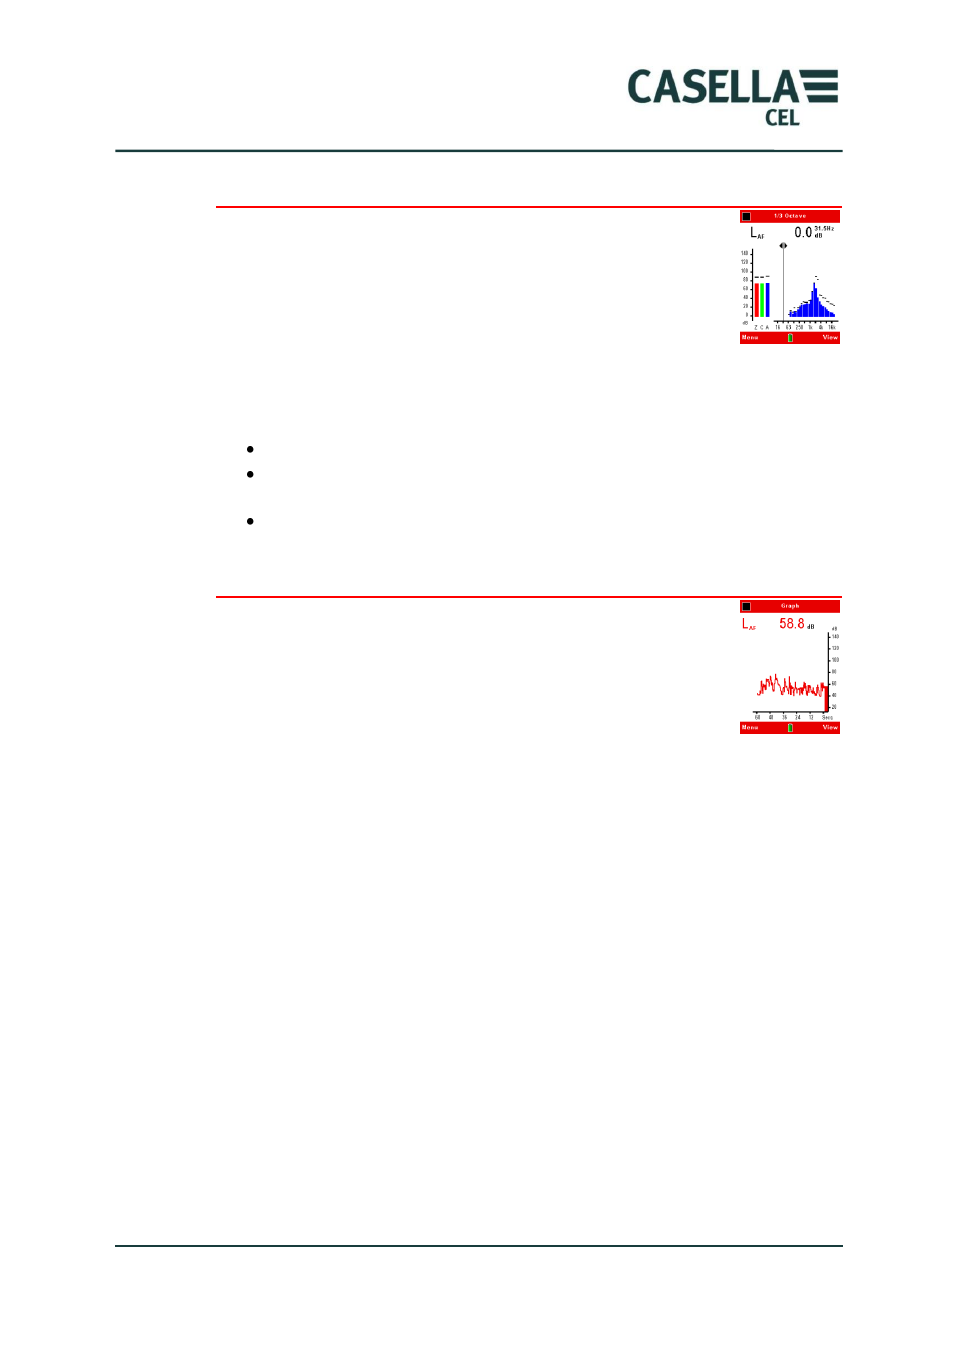
The Octave and 1/3 -Octave screen includes an octave spectrum
graph showing instantaneous and maximum noise levels for
each filter band, plus A, C and Z broadband measurements.
Short lines above the individual bars show the maximum
measurements for each filter band.
You can use the navigation cursor keys to select individual bars on the screen.
The screen shows the following measurements digitally:
The centre frequency of the selected octave, for example 2 kHz.
The sound pressure level (dB) of the measurement in the selected
octave.
The functions used for the measurement, for example L
AF
.
Graph
The Graph screen shows a single line graph using a vertical scale
of noise level and a horizontal scale of time.
The bar moves up and down to show the noise level, and the
graph scrolls to the left to show noise level over time.
Overload
An arrow pointing upwards
near the top right-hand corner of the screen
shows that an overload noise level that exceeds the instrument‟s measurement
range has occurred.
If this occurs, the measurement values shown will be incorrect, and you may
need to consider the validity of any measurements made.