Values screen, Graph screen, Marker screen – Casella CEL CEL-63X User Manual
Page 32
CEL-63x Environmental & Occupational Noise Meter
32
Casella CEL
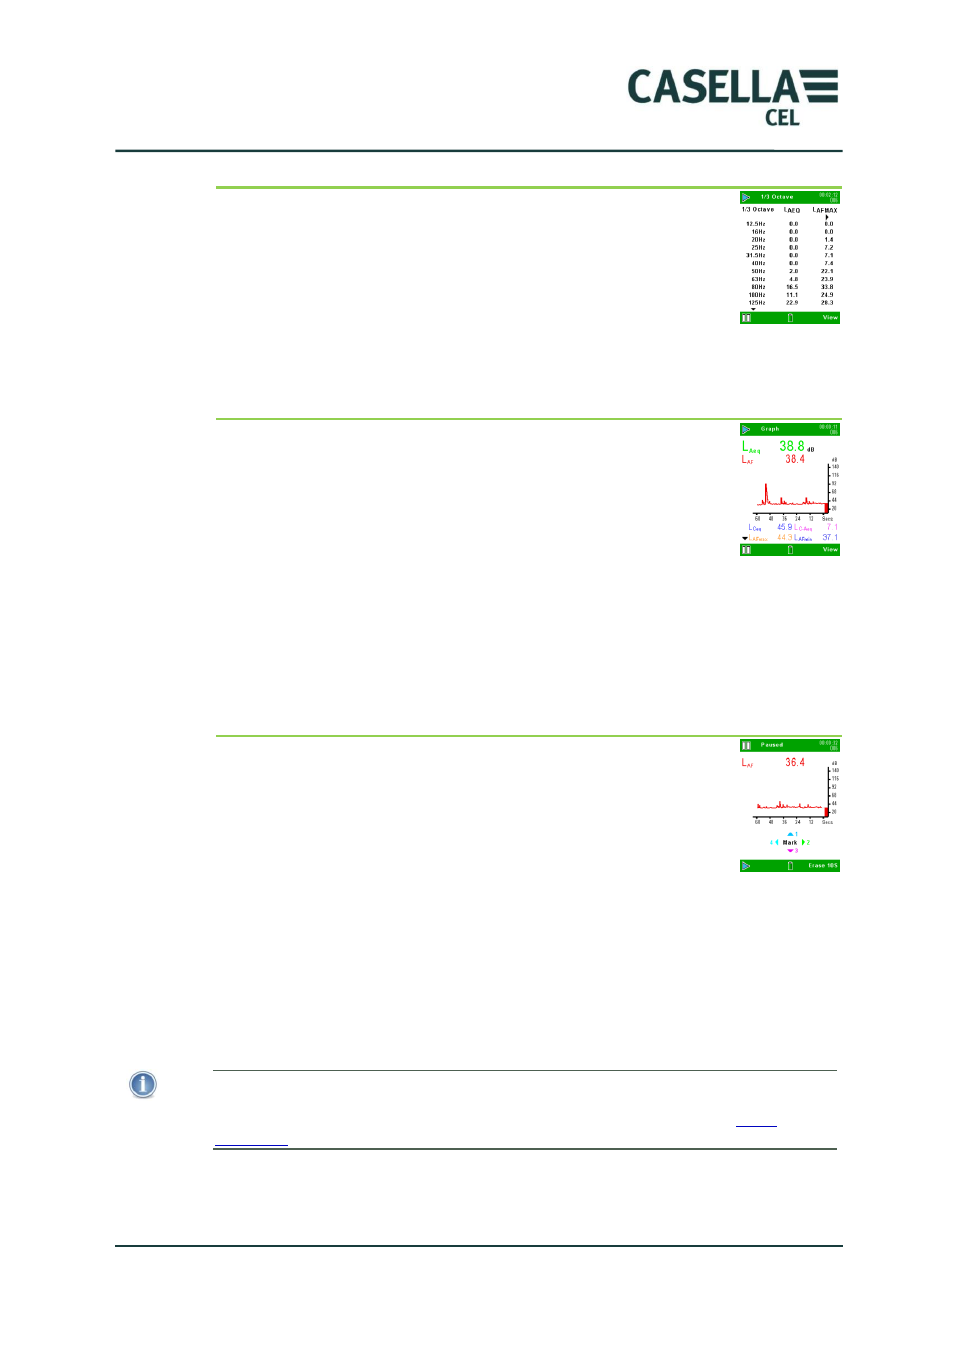
Values screen
The Values screen shows a list of the centre frequencies for each
octave or 1/3-octave, and columns of measurements (for
example to show L
Aeq
, L
AFmax
) for each of the centre frequencies.
Depending on instrument model additional frequency bands and
statistical values may be viewed by using the navigation keys to
scroll the display.
Graph screen
The Graph screen shows a graph of the CEL-63x instrument‟s
measurements taken over a period of time. The graph has a
horizontal scale of time, and a vertical scale of sound pressure
level (dB).
The more recent measurements are to the right of the graph.
The graph scrolls slowly to the left during the Run. Measurements that are
older than the displayed time span disappear at the left end of the graph.
The Graph screen also shows measurements digitally using different functions.
Marker screen
The Marker screen allows you to tag noise data with a specific
identity using one of four markers. For example, you can tag the
data to identify it as noise from an aircraft or from a road
vehicle.
Back erase
By pressing Pause when cumulative measurements are being made, „back erase‟
becomes available. The back erase option allows you to remove up to the last
10 seconds of noise data from the cumulative result. Note that if the
measurement has not been running for 10 seconds, back erase will erase up to
the start of the measurement.
The functions viewed on this screen can be changed.
NOTE
On CEL-632 and CEL-633 models, audio recording (if selected) will occur together with
a separate „event‟ measurement when a marker key is pressed. Refer to
on page 40 for details on this feature.