ONICON F-4000 Series User Manual
Page 46
11451 Belcher Road South, Largo, FL 33773 • USA • Tel +1 (727) 447-6140 • Fax +1 (727) 442-5699 • [email protected]
F-4000 Series Ultrasonic Flow Meter Manual 05/15 - 0707-13 / 18838
Page 46
9.
Record the information
shown on the flow meter
display.
Record readings shown for: Flow rate
Flow total
Valc – automatic gain setting
Vaer – aeration level
mV – signal strength
M/S – speed of sound(Vs)
Operating status (---------)
10. Measure and record analog or
pulse outputs.
Current Output:
Scaled Relay Otput:
Refer to flow meter wiring diagram for the various outputs based on your
particular installation. Use the following formulas to calculate flow rate from
measured analog signals:
GPM = (measured current in mA - 4) X Full Scale Analog Flow Rate
16
Each contact closure = unit volume identified as “Scale Factor” .(Measure
and record time interval between contact closures.)
11. Compare various output
signals to each other and to
the flow rate displayed by the
control system.
Compare the flow rate calculated in step 10 to meter display and to the flow
rate indicated by the control system. Refer to the troubleshooting section of
this manual when readings are inconsistent.
End of standard commissioning. Please contact ONICON at (727) 447-6140 with any questions.
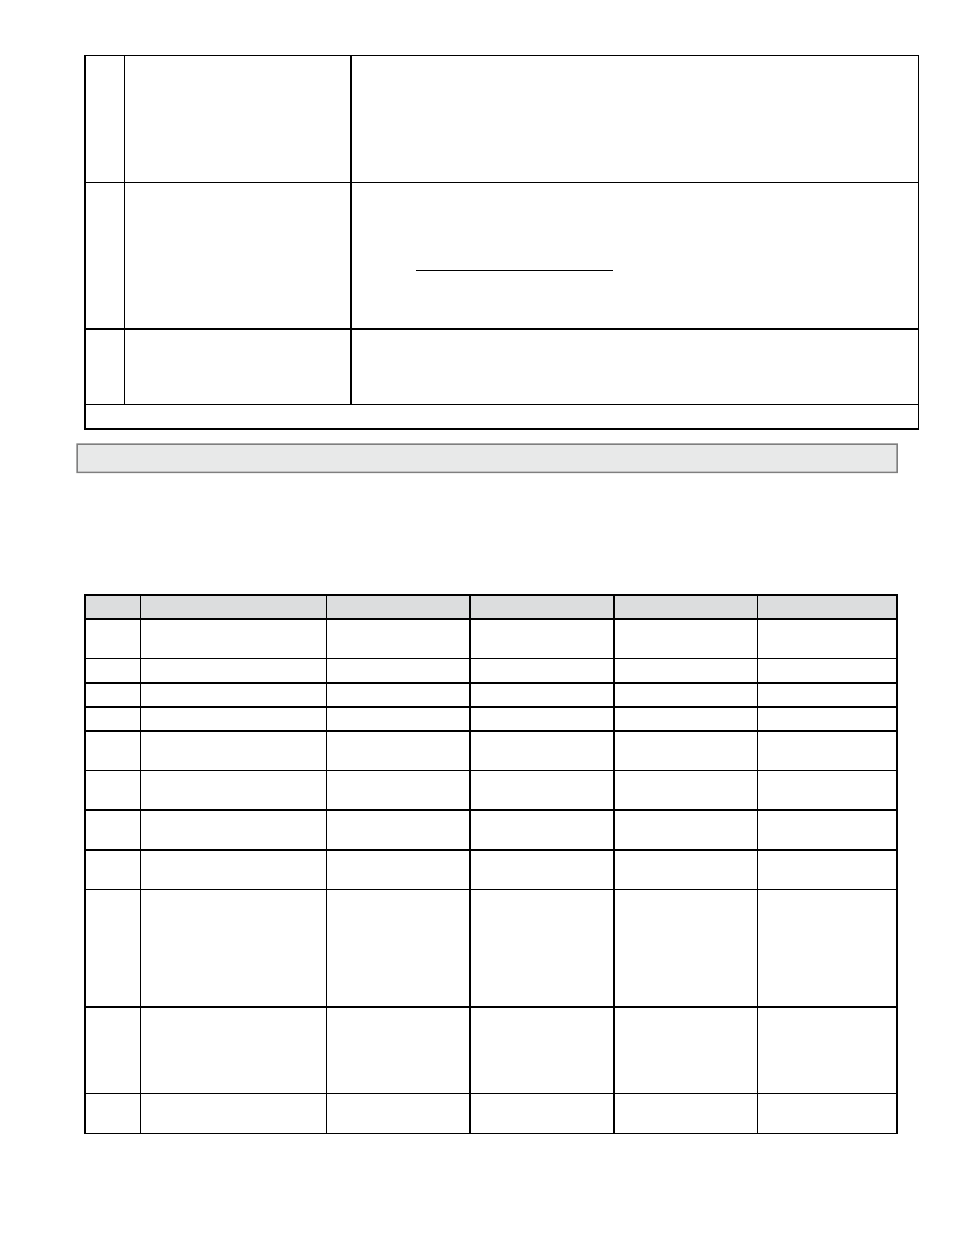
6.3 COMMISSIONING WORKSHEET
Please read all installation instructions carefully prior to proceeding with these steps. Use the
following worksheet for checking off the commissioning steps and recording measured values. The
following steps require flow in the pipe. Flow signal readings should be taken while holding the
flow rate constant, if possible. Otherwise, take the various output readings as quickly as possible.
STEP TEST/MEASUREMENT S/N:
S/N:
S/N:
S/N:
1.
Site selection/
location OK:
2.
Straight run OK:
3.
Measured pipe size:
4.
Record fluid type:
5.
Control system
programming OK:
6.
Record Btu meter /
display S/N:
7.
Signal & transducer
wiring Ok:
8.
Record measured
supply voltage:
9.
Record the
displayed data:
Rate ___________
Total __________
Valc ___________
Vaer ___________
mV ____________
Vs _____________
Status __________
Rate ___________
Total __________
Valc ___________
Vaer ___________
mV ____________
Vs _____________
Status __________
Rate ___________
Total __________
Valc ___________
Vaer ___________
mV ____________
Vs _____________
Status __________
Rate ___________
Total __________
Valc ___________
Vaer ___________
mV ____________
Vs _____________
Status __________
10.
Analog or pulse
output(s)
4-20 mA signal:
Scaled output interval:
Calculated flow rate:
___________mA
__________VDC
_____________
__________GPM
___________mA
__________VDC
_____________
__________GPM
___________mA
__________VDC
_____________
__________GPM
___________mA
__________VDC
_____________
__________GPM
11.
Flow rate displayed
by control system.
__________GPM
__________GPM
__________GPM
__________GPM