8 spl plot and signal selection for arrays – d&b TI 385 d&b Line array design User Manual
Page 26
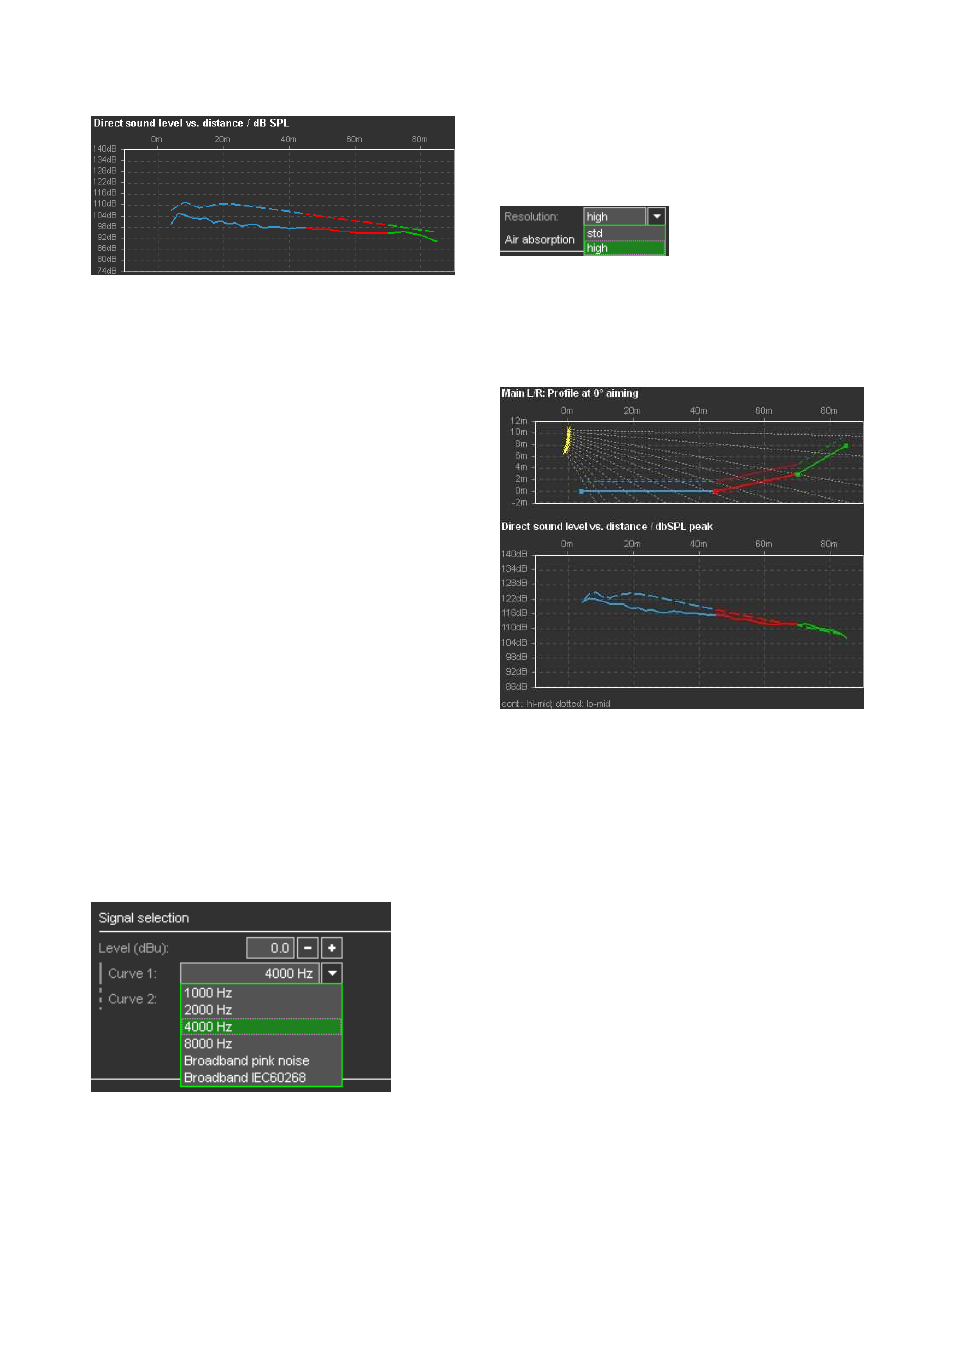
10.7.8 SPL plot and signal selection for arrays
The SPL plot shows the direct sound level vs. distance for
two frequency bands or alternatively for a broadband
signal for all active listening planes in the direction of the
selected array's horizontal aiming.
The reading is in dB SPL for the given input signal level
taking all signal processing settings for the individual
cabinets into account.
Curve 1 (continuous) can be selected to show the
high/midrange level distribution, selectable in octave bands
from 1000 Hz to 8000 Hz.
When one of the frequency bands is selected for curve 1, a
second curve (dotted) appears representing the lower
range selectable in octave bands from 63 Hz to 500 Hz,
where the dispersion is defined by the overall array curving,
not by the particular aiming of single cabinets.
The higher the frequency, the more the coverage is defined
by the individual aiming of each single cabinet. Using
4 kHz for the high/mid curve is a good compromise, giving
enough directivity information while not being affected too
much by the HF absorption of air. Try to match as closely as
possible the characteristics of the curves by modifying the
splay angle settings and switching between the octave
bands.
Increasing the splay between two cabinets will reduce the
high/mid level in their target area, decreasing the splay will
increase the level. As the plot only displays direct sound,
keep in mind that reverberant sound changes the balance
between low and high frequencies, typically towards the
lower frequencies. Allow a relative increase (not an
absolute increase) of higher frequencies towards larger
distances to maintain good intelligibility.
As an alternative to the octave frequency bands also pink
noise or IEC 60268 broadband signal can be selected for
the SPL simulation. In this case only one curve is visible.
These signals are particularly interesting to predict the
system headroom with typical music program.
The frequency weighting of the calculated broadband SPL
can be selected between linear, A-weighting and
C-weighting from the second list box.
Resolution
The spacial resolution of the
SPL calculation can be
changed from standard "std"
to "high" when fine-tuning the array. Please note that using
"high" resolution calculation times will increase by a factor
of 3.
The following two examples show different splay
configurations and the effect on the SPL distribution for a
12-deep array in the same venue.
12-deep J8/J12 setup, medium directivity
In the first setup the plots for low/mid and high/mid SPL
(4 kHz band) are very similar. The high/mid directivity of
the system is not very high in order to match the level drop
of the lower frequencies. As a consequence, the tonal
balance of the system's direct sound will be very consistent
over distance. This setup works in a room with low
reverberation and for program material where the tonal
balance is more important than optimum intelligibility and
level distribution in the far field.
TI 385 (6.0 EN) d&b Line array design, ArrayCalc V8.x
Page 26 of 54