1 time alignment of sub arrays – d&b TI 385 d&b Line array design User Manual
Page 39
In this example, the left sides (L) of the paired arrays were
taken as a basis because they are closer to the test point
than the right sides. The peaks at 148ms and 157 ms
represent the arrival times from the right sides of the paired
arrays. Note their relatively low levels and therefore
negligible influence at the selected position. These peaks
can be switched off by simply muting the right sides (R) of
the paired arrays.
The alignment for point sources is performed in a similar
way. Place the test point at a suitable position within the
target area of each point source and set the delay
accordingly. In case of distributed point sources, it may be
necessary to perform this procedure for each individual
source.
10.11.1 Time alignment of SUB arrays
It is vital to carry out a correct time alignment of ground
stacked or arrayed subwoofers to the main system.
ArrayCalc accurately calculates the settings necessary for
an optimum alignment at a user-defined distance from the
system, thus replacing a measurement system.
Note: Before evaluating the necessary time alignment,
make sure all mechanical and acoustic parameters as
well as the arc-shaping delay times of the SUB array
are set correctly and correspond to the actual setup at
the venue. Verify all actual distances, positions and trim
heights. Wrong parameters will deliver an incorrect
alignment.
If in doubt, use an acoustic measurement system to set
the delays (refer to section 10.19 Time alignment on
page 46).
Make sure to use the final delay setting for the selected
source to which the subwoofers are to be aligned. If the
source delays are modified later, the subwoofer
alignment has to be re-checked.
Selecting the source for alignment
Select one of the sources in the project for phase alignment
with the SUB array. Make sure to select a source with a
target dispersion that is reasonably similar to the SUB array.
Selecting the test point
You can select the distance (x value) at which the phase
responses of the SUB array and the selected source are
compared, either by clicking in the diagram and/or by
moving the test point around using the arrow buttons below
the diagram. This test point is always located at the y
position of the left source selected. This provides a good
alignment result for a wide area in the infield of an
audience area, including the FoH position. Choose an x
position at a sufficient distance from the sources. Usually a
typical FoH position is a good choice.
Calculating the phase response
The phase responses of both the selected source and the
SUB array at the test point are calculated using a complex
sum of all contributing sources including their angle-
dependent phase and level response and delay settings. To
obtain a useful phase plot, the distance of the closest
source to the test point is compensated for in the diagram.
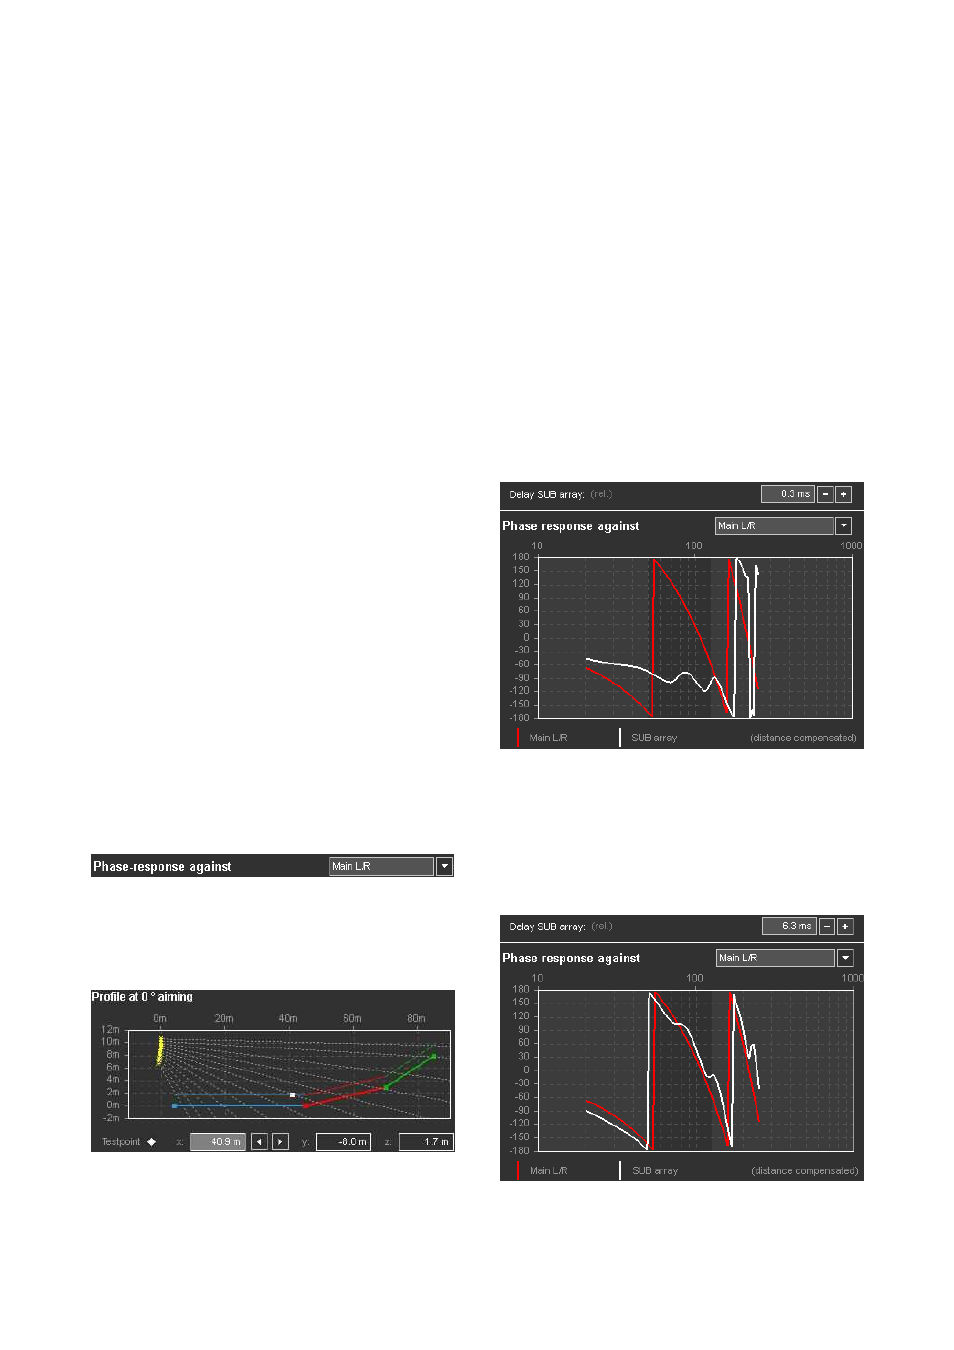
Set both delay values to minimum (0.3 ms) and check
which system sound arrives earlier (selected source or
SUBs).
It is the one with fewer "turns" in the phase response, since
a steeper phase curve means more delay.
Phase response - not aligned
In the above example it is the white trace representing the
summed response of the SUB array, indicating that the SUB
array needs additional delay for phase matching.
Gradually increase the delay of the earlier signal until the
two phase traces match each other within the relevant
frequency range ~55 Hz and ~120 Hz (dark area) as
well as possible.
Phase response - correctly aligned
TI 385 (6.0 EN) d&b Line array design, ArrayCalc V8.x
Page 39 of 54