HEIDENHAIN PWM 20 User Manual
Page 161
164
HEIDENHAIN ATS Software User's Manual
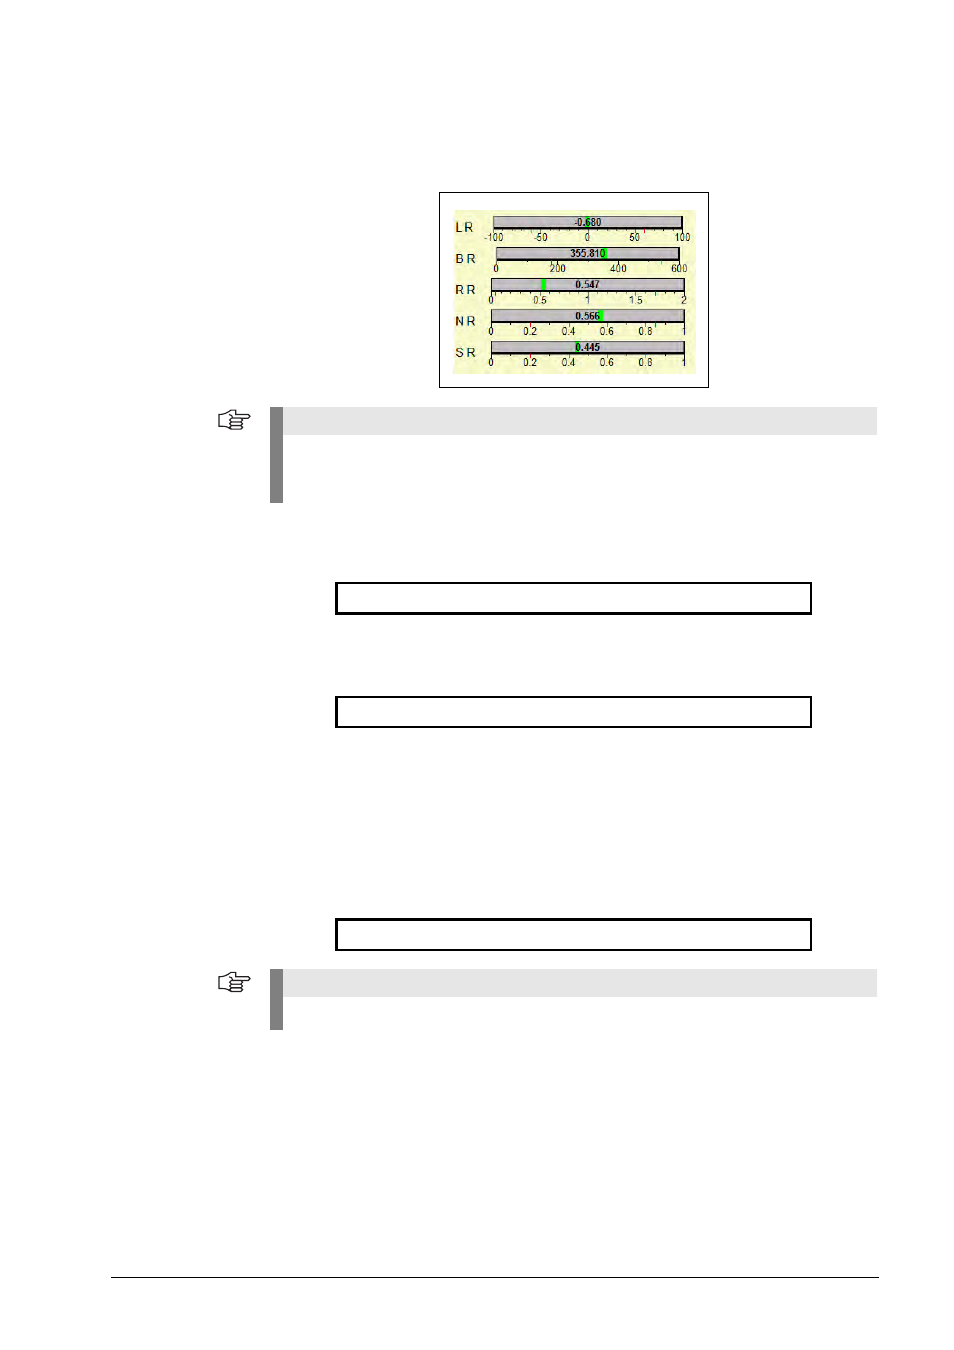
Designations of the bar graphs and calculations of the reference signal
The following information refers to the interface descriptions and the signal diagrams in there
(see chapter “Interface description” on page 209).
L R:
Position of the reference pulse
B R:
Width of the reference pulse
R R:
Quiescent value H of the reference pulse
N R:
Usable component G of the reference pulse
S R:
Switching threshold of the reference pulse
Note
The color of the bar graphs changes to red, if the tolerances are exceeded. Also observe the
red line markers in the scaling!
The stated tolerances are HEIDENHAIN standard values.
Formula: K - L / 2
Formula: K + L
Formula: E / G
Note
Meaning of K, L, E and G: see following signal diagrams (1 Vpp, 11 µApp).