5 level function - bar graph display, ttl level, 5 level function – HEIDENHAIN PWM 20 User Manual
Page 199
202
HEIDENHAIN ATS Software User's Manual
6.3.5 Level function
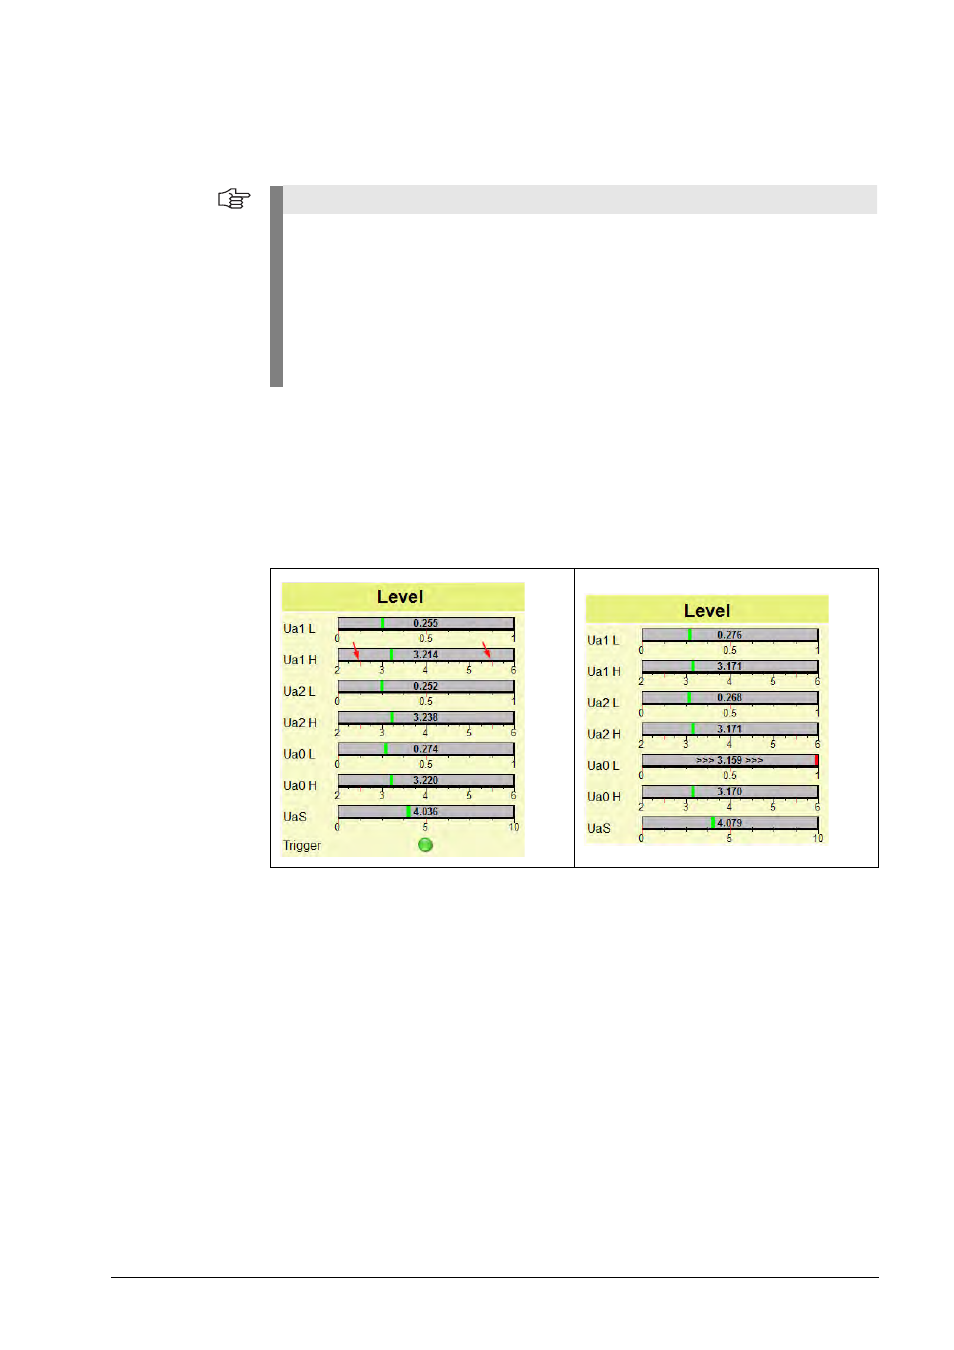
Bar graph display, TTL level
Display of the signal parameters and the level limits through bar graphs with tolerance markings.
(See red arrows at "Ua1 H" in the next picture.)
Colors of the pointers in the bar graphs
The left picture shows the level display with active reference signal trigger.
The LED briefly lights up green when the reference mark is detected.
If the reference mark was not found yet, or if it is faulty, a red line and/or multiple arrows
are displayed (Ua0 L in the picture to the right).
The fault-detection signal (-UaS) is only displayed, when inverted level measurement is active.
This signal level only changes to low level in the event of an error (low-active).
For level evaluation, do not display more than ten signal periods.
For level measurement not the absolute level is decisive, but the difference between
high signal (H) and low signal (L).
By means of the level limits set in the bar graphs, it is ensured that the difference between
H and L is sufficient (green line).
Note
The stated values are HEIDENHAIN standard values!
For standard values, refer to chapter “Interface description” on page 209.
The limit values of high-accuracy measuring systems (e.g. angle encoders) for encoders
with large temperature ranges (e.g. motor encoders), or for high shaft speeds may be
different! In this case the limits formed by the markings are invalid.
Changes to the tolerances of the bar graphs are impossible by default. (Product key required;
only available to experienced users and on request only!)
Please always refer to the original documentation of the encoders to be checked.
In case of doubt, contact the HEIDENHAIN helpline (see chapter “Contacts” on page 243).
Green bars:
Signals within the specified tolerance
Red bars:
Signals outside the specified tolerance
Multiple
arrows:
Scaling exceeded