Graphing and printing trend logs, Gpc-xp controller technical guide 46 – Orion System GPC-XP Controller User Manual
Page 46
Section 13: Trend Logging & Printing
GPC-XP Controller Technical Guide
46
Graphing and Printing Trend Logs
To print a log, fi rst
select
a printer from the
Default Printer Selec-
tion Dialog Box
(Figure 107 below) located at the bottom right
of the
Trend Logs Screen
and then
click
<Print>
. Every time you
open Prism 2, this printer selection will be the default printer until
you change it.
NOTE:
If you select a printer from this list box, it will become the
default printer for all programs on your computer unless you select
a different printer in Prism 2 or from the Windows
®
Control Panel.
Figure 106: Trend Log Graph
If you would like to export a day’s worth or month’s worth of log
data for further analysis not provided in Prism 2,
select
either
< Ex-
port Daily>
or
< Export Monthly>
. Prism 2 will create a comma
delimited .CSV fi le that can be opened in most spreadsheet and
database applications.
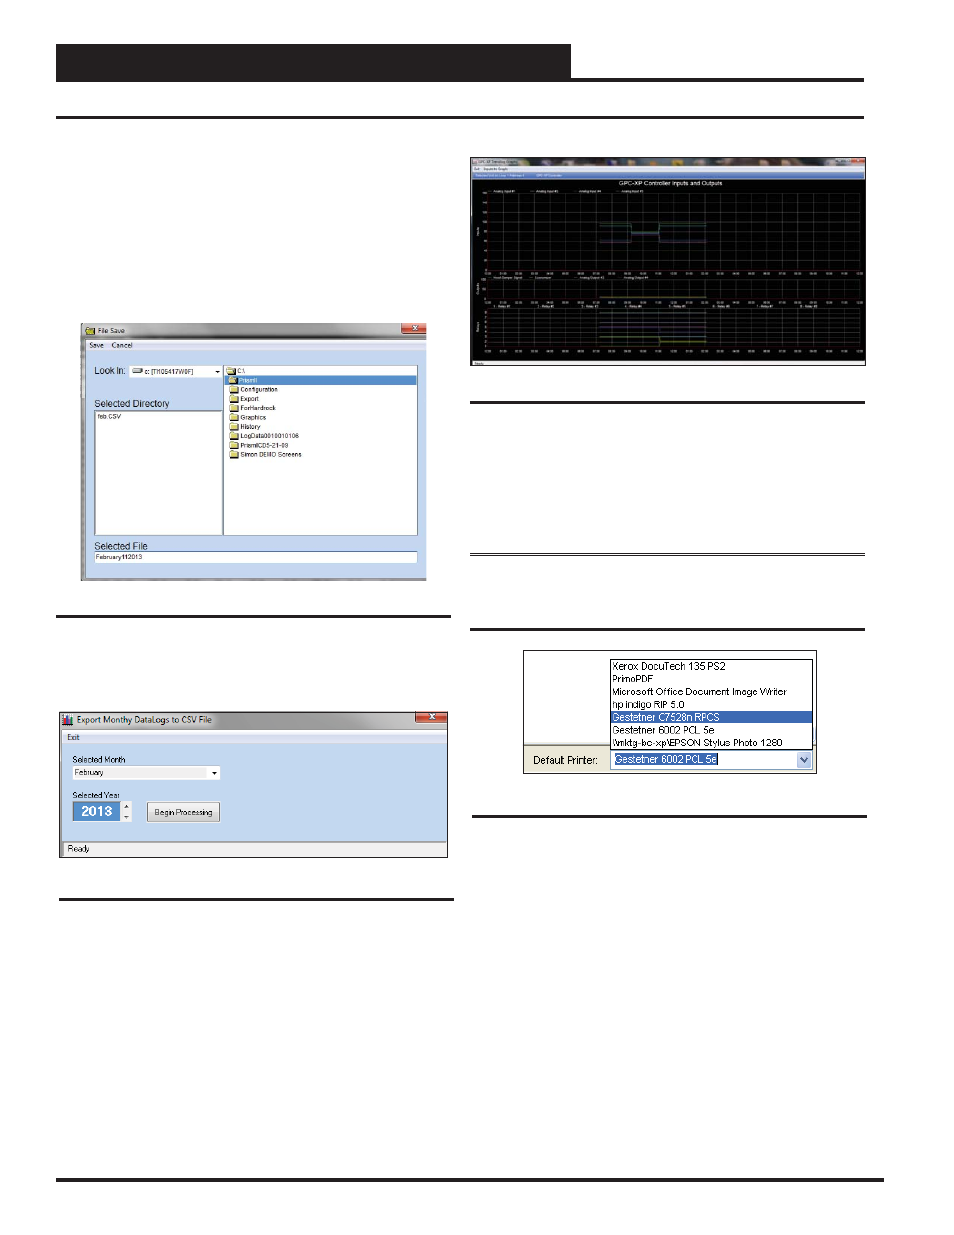
If you
select
<Export Daily>
, the File Save Dialog Box will appear
(Figure 104 below). Select the directory you wish to save the data
to and enter a fi le name. Then click
<Save>
.
If you
select
<Export Monthly>
, the following dialog box will ap-
pear (Figure 105 below):
Figure 105: Export Monthly Data Logs
Figure 106 is a sample line graph display.
Select the month and the year and click
<Begin Processing>
. The
File Save Dialog Box will appear (Figure 104 below). Select the
directory you wish to save the data to and enter a fi le name. Then
click
<Save>
.
To graph data from a log,
click
<Graph>
. The
Log Selection Window
will appear again.
Select
a highlighted date to graph. The
Trendlog
Graph Screen
will fi ll up your entire computer display.
Click
<Exit>
to return to the
Trend Log Screen
.
Figure 107: Printer Selection Dialog Box
Figure 104: Trend Log Graph