Oscilloscope – Wavecom W61PC V7.5.0 User Manual
Page 81
WAVECOM Decoder W61PC/LAN Manual V7.5
Analysis Tools
71
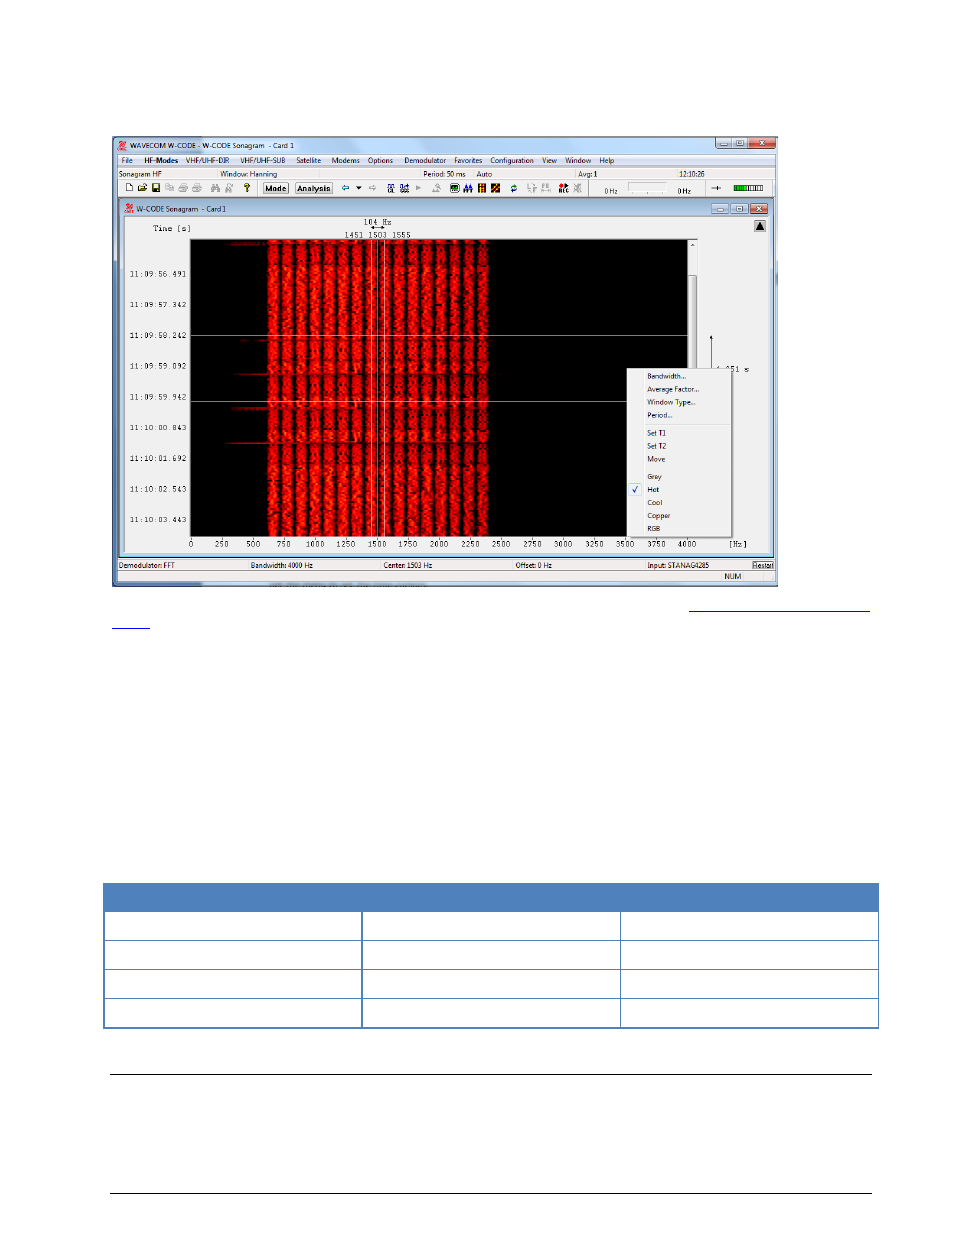
This amplitude related spectrum analysis mode offers many hints to the distribution of a signal spectrum.
The operation is numerically identical to the real-time waterfall analysis, and is simply a different method
of visualisation.
Options can be set using the right mouse button or the context menu (see “
” on page 59). It is possible to remove the tuning FFT or Sonagram in the View Menu.
Making measurements
With the four cursors it is possible to make measurements in the frequency and time domain. To enable
the time cursors, click into the sonagram to freeze the screen. Then click with the right mouse button to
get the menu to set the time cursors.
T1
Add first cursor to the actual mouse position
T2
Add second cursor to the actual mouse position
Move Move T1 cursor and T2 cursor simultaneously
It is also possible to drag the cursor to a new location. If the cursor line gets in the upper our lower part of
the window, then the window will scroll automatically.
Sonagram HF, Sonagram SUB, Sonagram DIR, Sonagram SAT
FFT Type
Start Frequency
End Freqeuncy
Sonagram HF
Offset Frequency
Bandwidth
Sonagram SUB
Offset Frequency
Bandwidth
Sonagram DIR
Offset Frequency – Bandwidth/2
Offset Frequency + Bandwidth/2
Sonagram SAT
Offset Frequency – Bandwidth/2
Offset Frequency + Bandwidth/2
Oscilloscope
In general, an oscilloscope is used to measure voltage over time. However, the oscilloscope displays a rel-
ative and un-calibrated value. After obtaining the measurement time, frequency can be determined.