Interpreting the gain reduction meter displays – Omnia Audio Omnia A/XE User Manual
Page 51
over time. During normal operation, the indicators will have a dynamic “bounce” that you
will be able to get a feel for. Every now and then, you will see the processor react quickly
and show a larger amount of gain reduction. Notice that the response is very fast. This
action will recover very slowly, and return to “rest” with the main bar graph. This action will
be easily noticed on material that is very dynamic in texture. More on this below.
Another feature unique to Omnia A/XE is processor “Hold”. During brief pauses in audio,
the bar graphs will “freeze” and the GATE indicators will show the processor has entered
the Hold mode of the algorithm. This is most easily noticed when there is a “dry” voice
being processed.
The Input/Output level meters will change from green to red whenever the level exceeds
–12dBfs. The pills also change color on the Input/Output displays. In the dynamic process-
ing section the pills maintain the same color.
Note: The input and output levels are displayed relative to 0dB full scale (0dBfs). The 0 indicator on the
input/output bar graphs means that every available bit of signal level is being used at that time! There
is nothing more in the level department, except to create distortion… nasty sounding distortion!
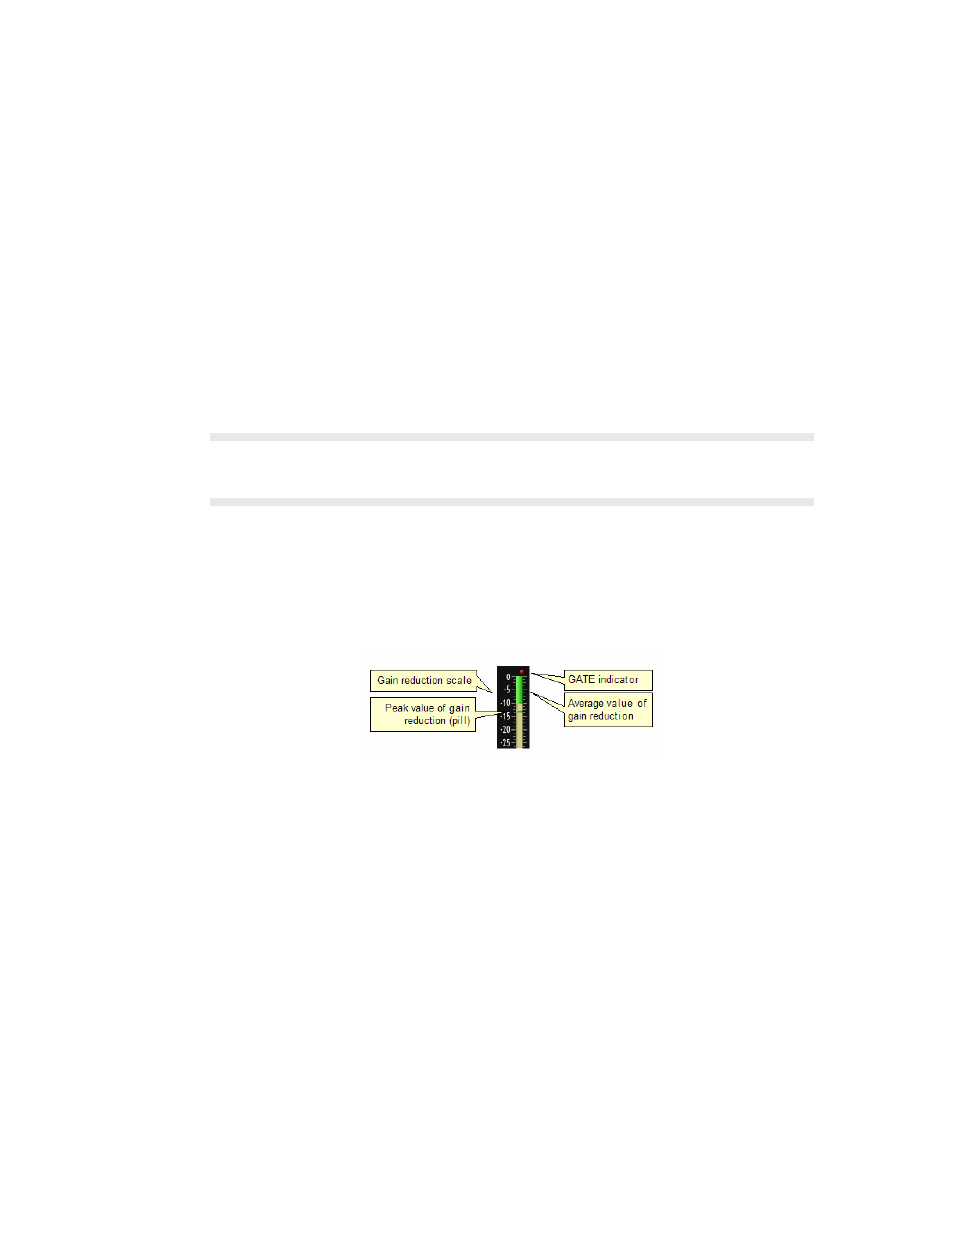
Interpreting the Gain Reduction Meter Displays
Through careful observation of the processing bar graphs, significant information can be
acquired and analyzed about the audio signal on a moment-by-moment basis. The bar
shows the average value of the gain reduction, while the floating pill indicates the peak
value of gain reduction.
Since the processing algorithms in Omnia A/XE ‘adapt’ to the audio, it is capable of
performing many different processing functions at different times. The processing display
bar graphs may appear to indicate different kinds of operation with different program mate-
rial. This behavior is primarily based on dynamic range differences in the applied program
material. For program material that is already processed or lacking dynamic range, the bar
graphs will indicate differently than with material that possesses a high degree of dynamic
range. This is because audio signals that lack dynamic range, naturally or by previous
processing, will possess a lower peak to average ratio. Conversely, audio signals with a wide
dynamic range possess a higher peak to average ratio. The Omnia A/XE adapts differently
to each case.
For program material that has low dynamic range (or high RMS and low peak levels),
there will be more activity in the WB-AGC sections and less activity in the Multiband
Processors. This behavior is due to the WB-AGC response to high RMS energy, while the
Multiband section is reacting to lower peak energy. Sometimes the Multiband section may
not indicate any action at all. For Omnia A/XE, this is completely normal! Examples of
this behavior might be seen with heavily processed commercials or music, or with music
passages of sustained level. A good example is the Aerosmith CD “Pump.” This recording
has very little dynamic range. Try any up-tempo selection from this disk and you will see
the Wideband-AGC section make initial adjustments along with small amounts of limiting.
UNdErSTANdING ThE BAr GrAPhS ANd INdICATOrS | 45