Status tab – Wavetronix Command Translator (CMD-DT) - User Guide User Manual
Page 59
58
CHAPTER 5 • SYSTEM PAGE
Figure 5.1 – System Information and Settings Page
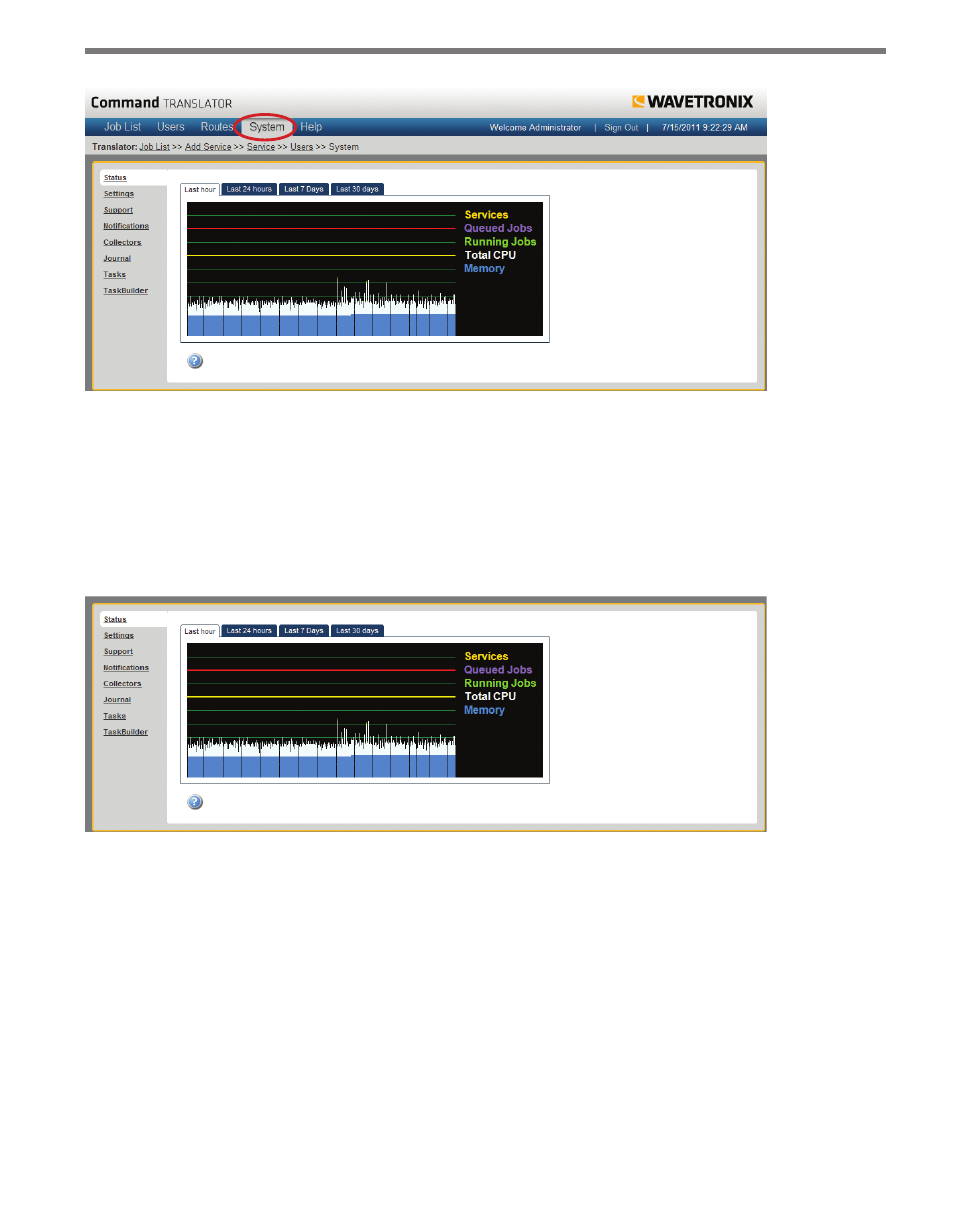
Status Tab
Click the Status link to access the Status screen (see Figure 5.2). This section consists of
four graphs that display information pertinent to the performance of the Translator system
as a whole.
Figure 5.2 – Status Screen
The tabs across the top of the screen allow you to select the time period for which the graph
displays information: last hour, last 24 hours, last 7 days and last 30 days.
Each graph contains the following five performance indicators: services, queued jobs, run-
ning jobs, total CPU, and memory. In an effort to better indicate when the peak output is
reached, these five indicators are stacked on top of one another. This means that even if
both CPU and memory usage are at 100%, the graph will only indicate a load of 70%. The
number of running services and running/queued jobs completes the remaining 30%.