7 statistics, User interface, 1 statistics display – KACO Powador XP200-HV TL User Manual
Page 45
User interface
Operating Instructions Powador XP200-HV TL, XP250-HV TL, XP350-HV TL_EN
Page 45
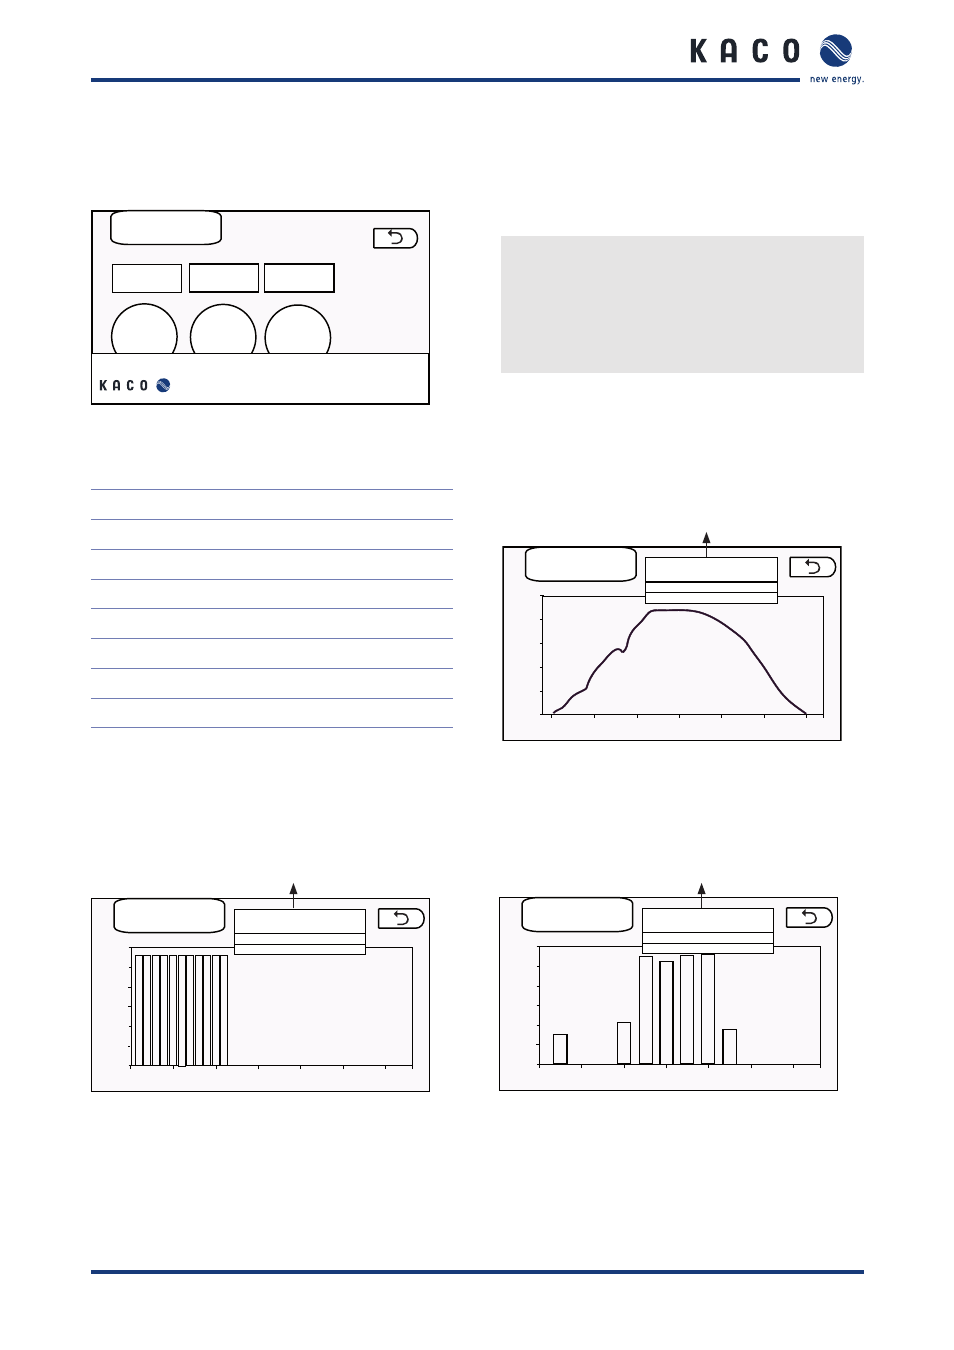
8.4.7 Statistics
The statistics function displays the data that was recorded on the SD card as a diagram.
Day
Specific date
Statistics
Month
Year
1.
1.
2010
back
Select time period
"
Select one of the three combination fields.
Day (daily statistics)
Month (monthly statistics)
Year (annual statistics)
"
Select a specific date.
Figure 47: “Statistics” screen
8.4.7.1 Statistics display
Parameter
Day
Month
Year
Daily statistics
Grid power
x
x
x
19:00
17:00
15:00
13:00
11:00
09:00
07:00
0
20
40
60
80
100
Parameter selection
Grid power (kWh)
Day
Jun 13, 2009
back
Figure 48: “Day” screen with daily statistics
PV power
x
x
x
PV voltage
x
PV current
x
PV temperature
x
Insolation
x
Line voltage
x
Statistics are available as long as the relevant parameters were recorded. Recording is activated for all values by
default. Monthly and annual statistics are recorded over the time period as cumulative values.
Monthly statistics
Annual statistics
30
25
20
15
10
5
0
0
100
300
400
500
600
200
Parameter selection
PV power (kWh)
Month
Jan, 2009
Figure 49: “Month” screen with monthly
statistics for the last nine months
12
10
8
6
4
2
0
0
3000
9000
12000
15000
18000
6000
Parameter selection
Grid power (kWh)
Year
2009
back
Figure 50: “Year” screen with annual statistic