Service table screen, Data line monitor, Service table screen -16 – Verilink WANsuite 5370 (34-00310.D) Product Manual User Manual
Page 132: Data line monitor -16
4-16
W A N s u i t e 5 3 7 0
Current Pin Status
The Current Pin Status, which shows the state of the RS-232 pins, is displayed
at the bottom of the Supervisory Config screen.
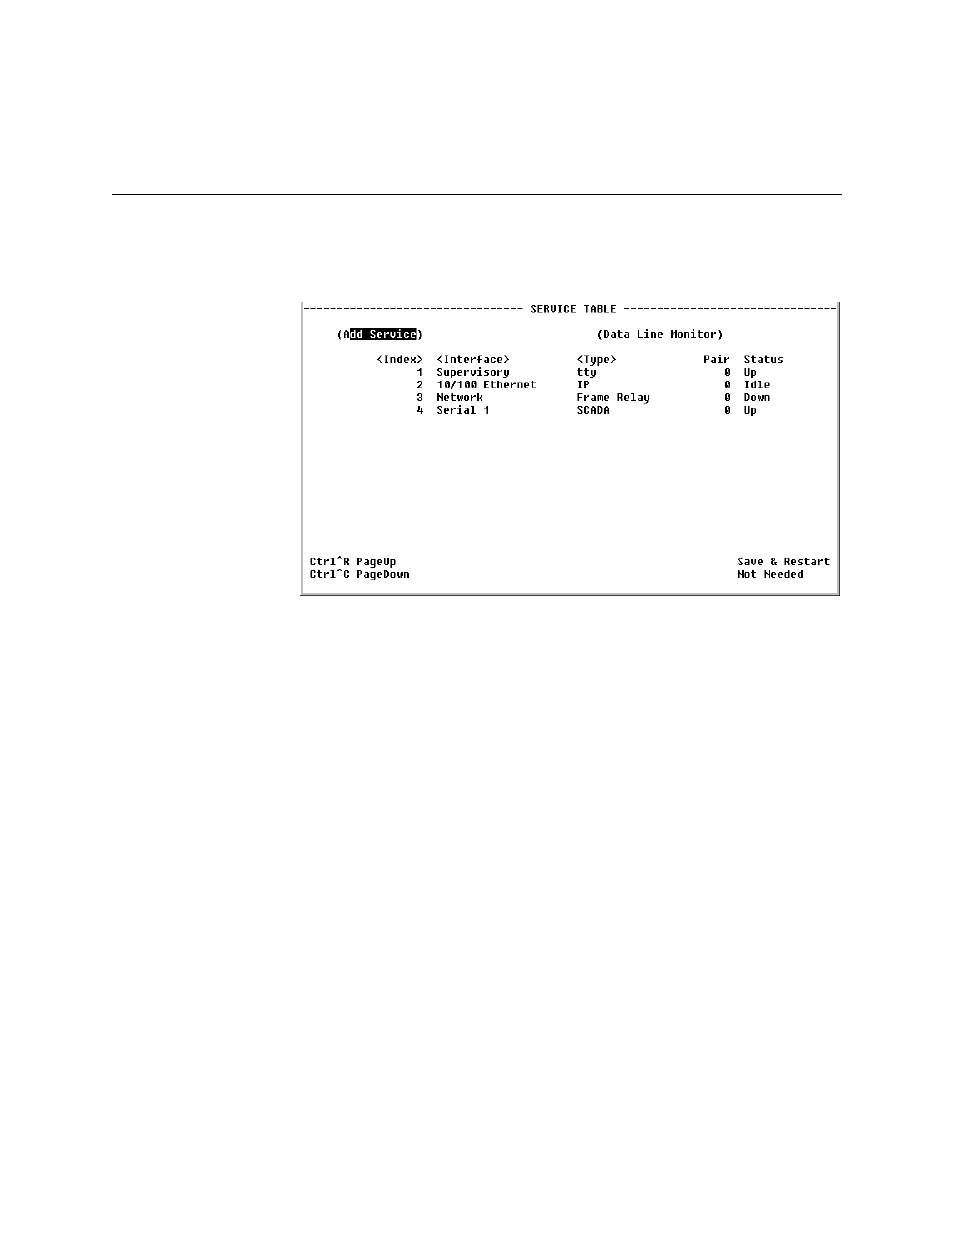
Service Table Screen
The Service Table screen (Figure 4.14) provides a view of the unit’s defined
services and displays the Interface, Type, Pair, and Status parameters for each
service.
Figure 4.14
Service Table Screen
The Status for a particular service will display as one of the following:
•
Dead
−
The service is not functional because required resources are not
available.
•
Changed
−
The service parameter was changed and a Save and Restart is
required for the service to function.
•
Down
−
The service is not able to pass data because the physical layer is
down.
•
Physical Up
−
The service is not able to pass data because it has not
completed any required negotiations.
•
Up
−
The service is ready to pass data.
•
Idle
−
The service has nothing to do.
The Service Table screen displays the available services listed by Index
number. To view more detailed information about a service, navigate to one
of the Details screens by selecting from an entry under the “Index” column
(Service Details), the <Interface> column (Interface Details), or <Type>
column (Type Details). To add a service, select the “Add Service prompt at
the top of the screen.
Data Line Monitor
Select the Data Line Monitor prompt at the top of the Service Table screen to
view a screen that displays SCADA port information (Figure 4.15).