Data line monitor table, Data line monitor table -23 – Verilink WANsuite 7105 (34-00316.C) Product Manual User Manual
Page 157
V T 1 0 0 I n t e r f a c e
4-23
4-23) by selecting from an entry under the “Index” column (Service Details),
the <Interface> column (Interface Details), or <Type> column (Type Details).
To add a service, select the “Add Service prompt at the top of the screen.
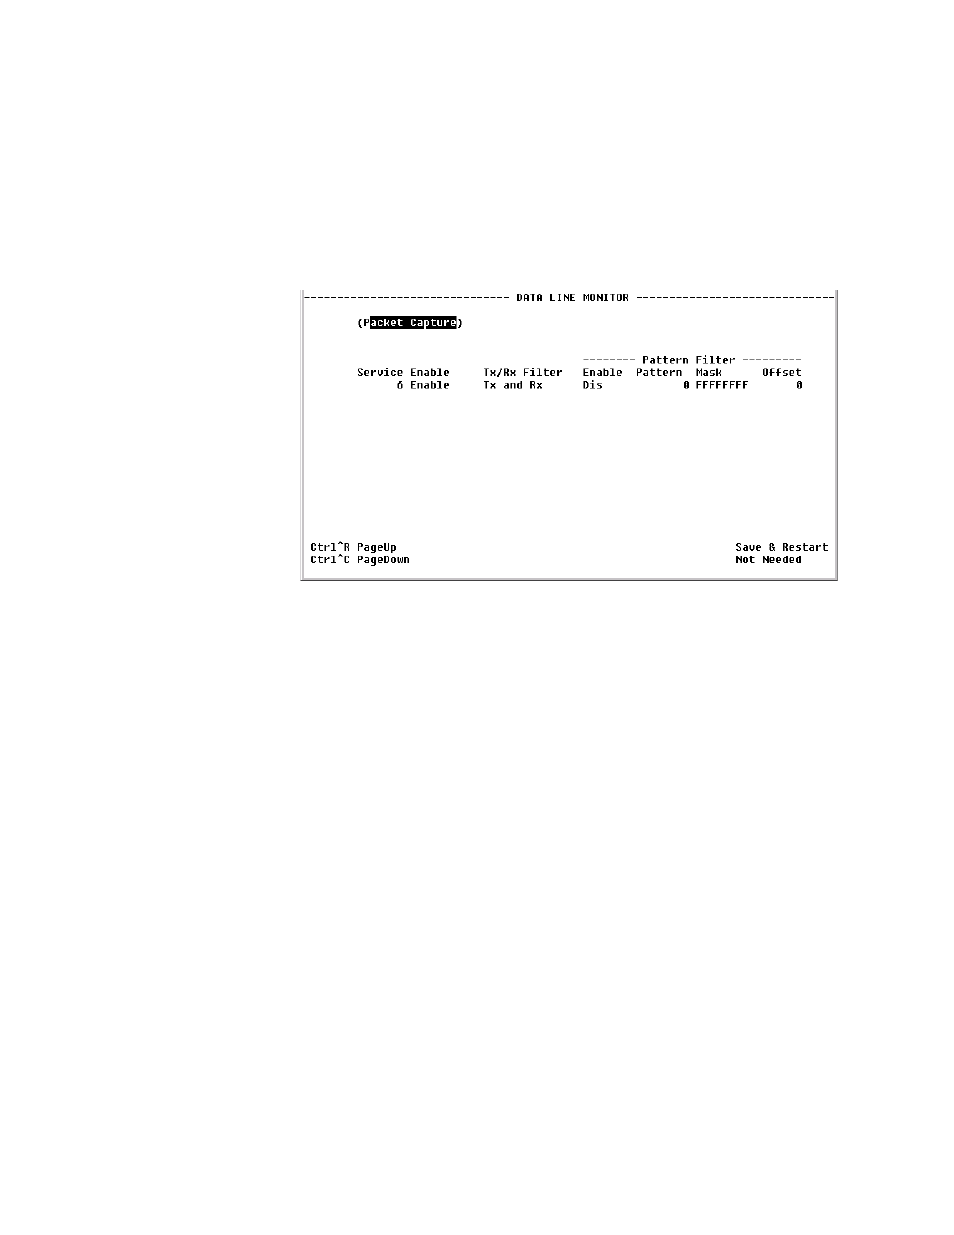
Data Line Monitor Table
Select the Data Line Monitor prompt at the top of the Service Table screen to
view a screen that displays SCADA port information (Figure 4.17).
Figure 4.17
Data Line Monitor Table
Service Enable and
Disable
Displays whether capture is Enabled or Disabled.
Tx/Rx Filter
Displays the direction of the captured data.
Pattern Filter Enable
Displays the Filter for the pattern being searched and captured.
Pattern
Displays which specific pattern is being searched for.
Mask
Displays the bits the unit is looking for.
Offset
Displays the offset in the packet that matches the pattern.
You may view the captured data in the Data Monitor Packet Table screen
(Figure 4.18) by selecting the “Packet Capture” prompt at the top of the Data
Line Monitor screen. The screen shows about 10 lines of active data, and if a
line is selected, the screen will display further decoded data below.