Diagnostics, Diagnostics screen, Diagnostics -79 – Verilink WANsuite 7105 (34-00316.C) Product Manual User Manual
Page 213: Diagnostics screen -79
V T 1 0 0 I n t e r f a c e
4-79
Figure 4.75
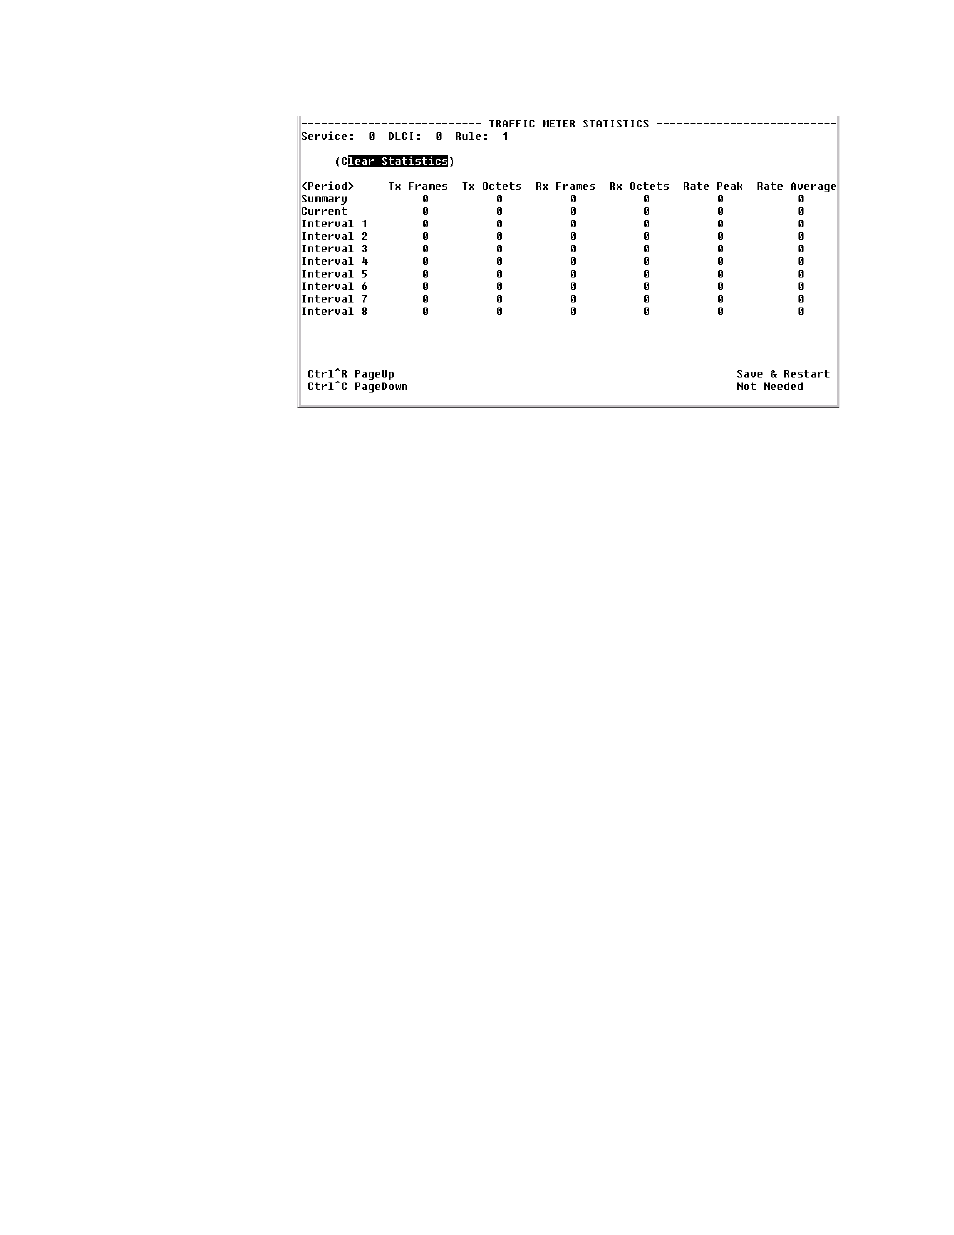
Traffic Meter Statistics Screen
The Traffic Meter Statistics screen reports on the following parameters:
•
Tx Frames
•
Tx Octets
•
Rx Frames
•
Rx Octets
•
Rate Peak – the peak data rate for the viewed period (see below)
•
Rate Average – the average data rate for the viewed period (see below)
The <Period> indicates the period of time for which the Traffic Meter
statistics are reported as listed below.
Summary
Represents the past 24 hours; reports the additive number of frames/octets, the
highest peak encountered for 24 hours, and the average for 24 hours.
Current
Reports on the current 15-minute interval.
Interval 1,
Interval 2,...,
Interval 96
Reports on Intervals 1-96, which correspond to the periods completed 15
minutes ago, 30 minutes ago,..., 24 hours ago.
Diagnostics
The WANsuite 7105 provides Diagnostics for all interfaces.
Diagnostics Screen
The Diagnostics screen (Figure 4.76) provides a table for viewing the current
settings for the test and maintenance functions performed on the available
interfaces. This screen shows an upper-level view of all the interfaces so you
can see if any port is under test, and if so, view the results. You may change
diagnostic parameters on the Test Details screens, which are accessed by
selecting the appropriate interface in the <Description> column.