Deep insertion compensation, Speech signal analysis – Audioscan Verifit User Manual
Page 114
Verifit
®
User's Guide Version 3.12
May 2015
1600
4.9
3.9
3.7
4.2
0.0
6.1
2000
6.1
6.9
6.9
8.1
-4.0
6.1
2500
1.8
5.1
5.5
7.4
-3.0
6.4
3150
-0.4
2.7
2.9
5.7
-2.0
6.6
4000
0.2
6.0
4.8
8.6
0.0
7.7
5000
2.6
10.4
7.9
12.7
0.0
8.1
6300
3.0
5.2
1.2
9.0
0.0
8.4
8000
3.7
-1.6
-0.4
3.5
0.0
8.4
Microphone location effects are added after the overall rms level has been set
Note: Microphone location effects remeasured 2014 on KEMAR and referenced to sub-lobe position. Software
versions prior to 3.10.56 use MLE values from DSL 4.1 so slight changes in Test box Speechmap should be
expected.
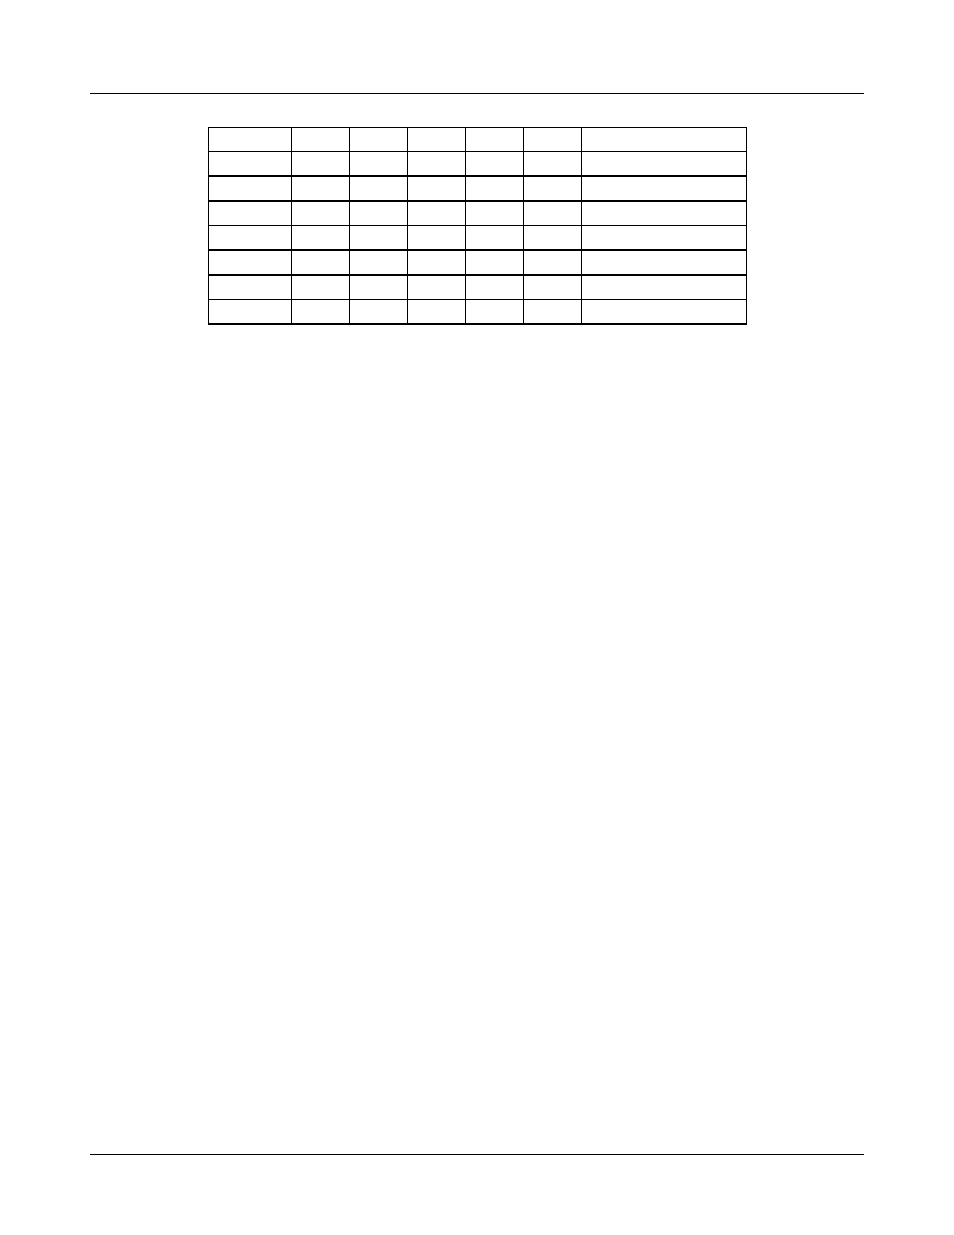
Deep insertion compensation
The deep insertion of a hearing aid or ear-mold causes the ear canal SPL to be higher than would be estimated
by adding RECD to the coupler SPL measured in the test box. This most commonly occurs with Completely-in-
Canal (CIC) hearing aids. When this hearing aid type is selected in Speechmap Test box, a deep insertion factor
is automatically added to the estimated ear canal SPL. The factor in the following table is from DSL 5.0 and has
been interpolated to 1/3 octave frequencies.
Speech signal analysis
One of the most-used measures of a speech signal is the long-term average speech spectrum (LTASS). This is a
1/3 octave spectrum averaged over a sufficiently long portion of the speech material to provide a stable curve. In
practice a 10 second average meets this requirement and, for this reason, all Verifit passages are at least 10
seconds long.
The dynamic nature of speech is often characterized by the distribution of short-term levels in each 1/3 octave
band. These levels are determined by calculating a spectrum for each of a series of short time periods within the
passage. Historically, time periods of 120, 125 or 128 ms have been used. The Verifit uses a 128 ms time period,
resulting in 100 levels (or samples) in each 1/3 octave band for a 12.8 second passage. The level in each band
that is exceeded by 1% of the samples (called L1 or 99th percentile) has historically been referred to as the
speech peak for that band. The curve of the 99th percentile is approximately 12 dB above the LTASS. The level
in each band that is exceeded by 70% of the samples (called L70, or 30th percentile) has historically been called
the valley of speech for that band. The curve of the 30th percentiles is approximately 18 dB below the LTASS.
The region between these two curves is often called the speech region, speech envelope or speech 'banana'. The
speech envelope, when derived in this way, has significance in terms of both speech detection and speech
understanding. Generally, speech will be detectable if the 99th percentile is at or near threshold. The Speech
Intelligibility Index (SII) is maximized when the entire speech envelope (idealized as a 30 dB range) is above
(masked) threshold. This will not be an SII of 100% (or 1) because of loudness distortion factors, but higher SII
values will not produce significantly higher scores on most test material. The speech-reception threshold (SRT)
is attained when the LTASS is at threshold (approximately - depending on test material and the individual)
114