Ansi test results, Ansi input-output curves – Audioscan Verifit User Manual
Page 47
Verifit
®
User's Guide Version 3.12
May 2015
settings that result in the highest gain for soft sounds and the lowest gain for loud sounds. This will typically
result in the lowest compression threshold, a flat I/O curve and the longest attack/release times. These are not
'typical' characteristics but indicate the adjustment range possible for these parameters.
If you are unsure which test sequence to run, try [AGC] first. If attack and release times are all near zero, the
instrument is probably linear.
ANSI test results
In 1996 tests: Full-on average gain is measured at 50 dB SPL, average gain at RTP is usually (but not always)
measured at 60 dB SPL and the frequency response is run at 60 dB SPL for linear aids or at 50 dB SPL for AGC
aids.
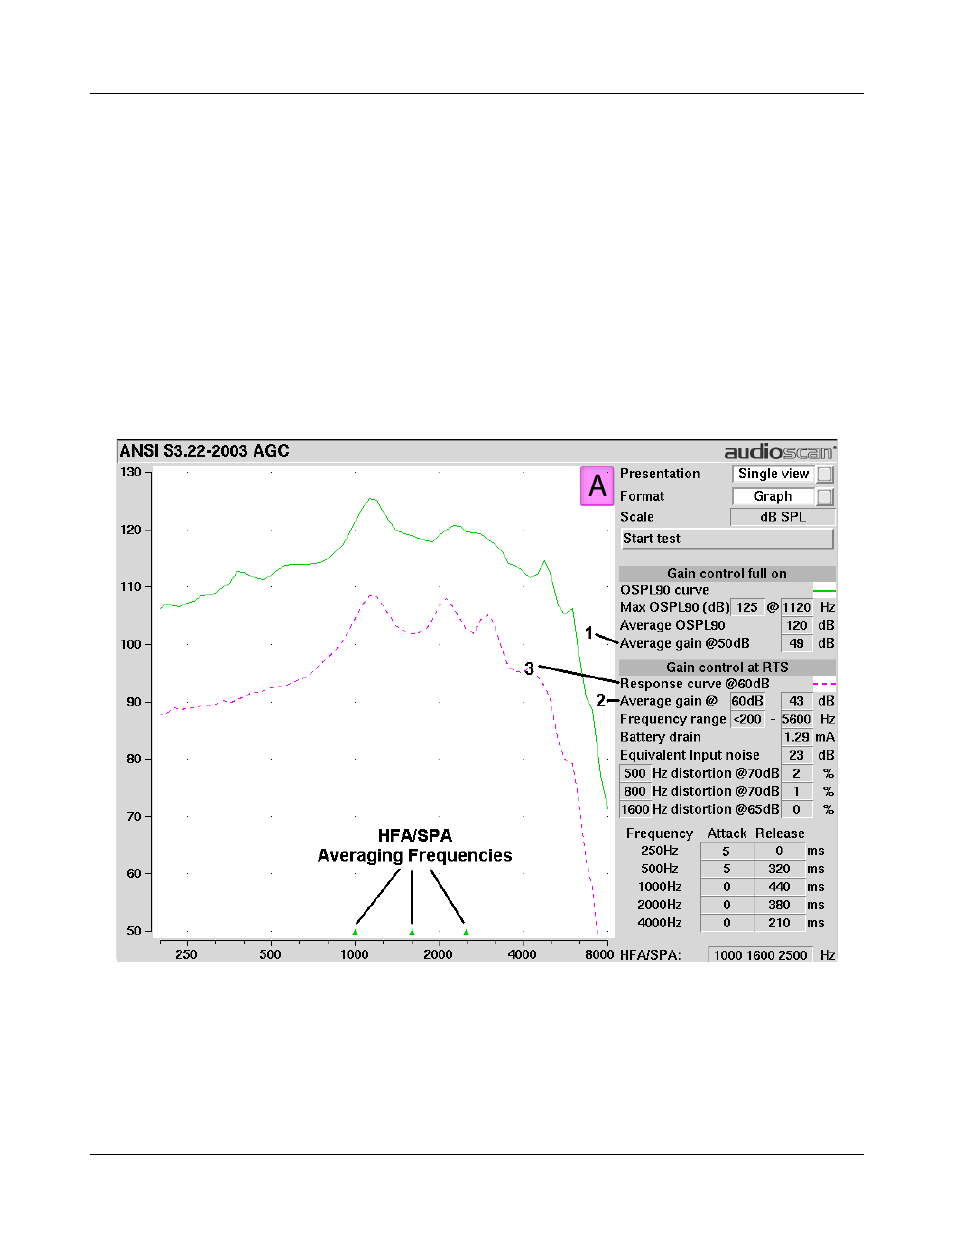
In 2003 tests: Full-on average gain (1) is measured with a 50 dB input SPL, average gain at RTS (2) is always
measured at 60 dB input SPL and the frequency response curve (3) is always run at 60 dB input SPL.
ANSI input-output curves
An input/output curve shows the output level of a hearing instrument as a function of input level and frequency.
It is a steady-state pure-tone curve and does not reflect performance with complex signals such as speech.
You may run the tests at any setting of the instrument controls but ANSI S3.22 requires that certain settings be
47