Audioscan Verifit User Manual
Page 151
3.1 Pink noise signal analysis
All band levels are calculated with an averaging time
of 128 ms.
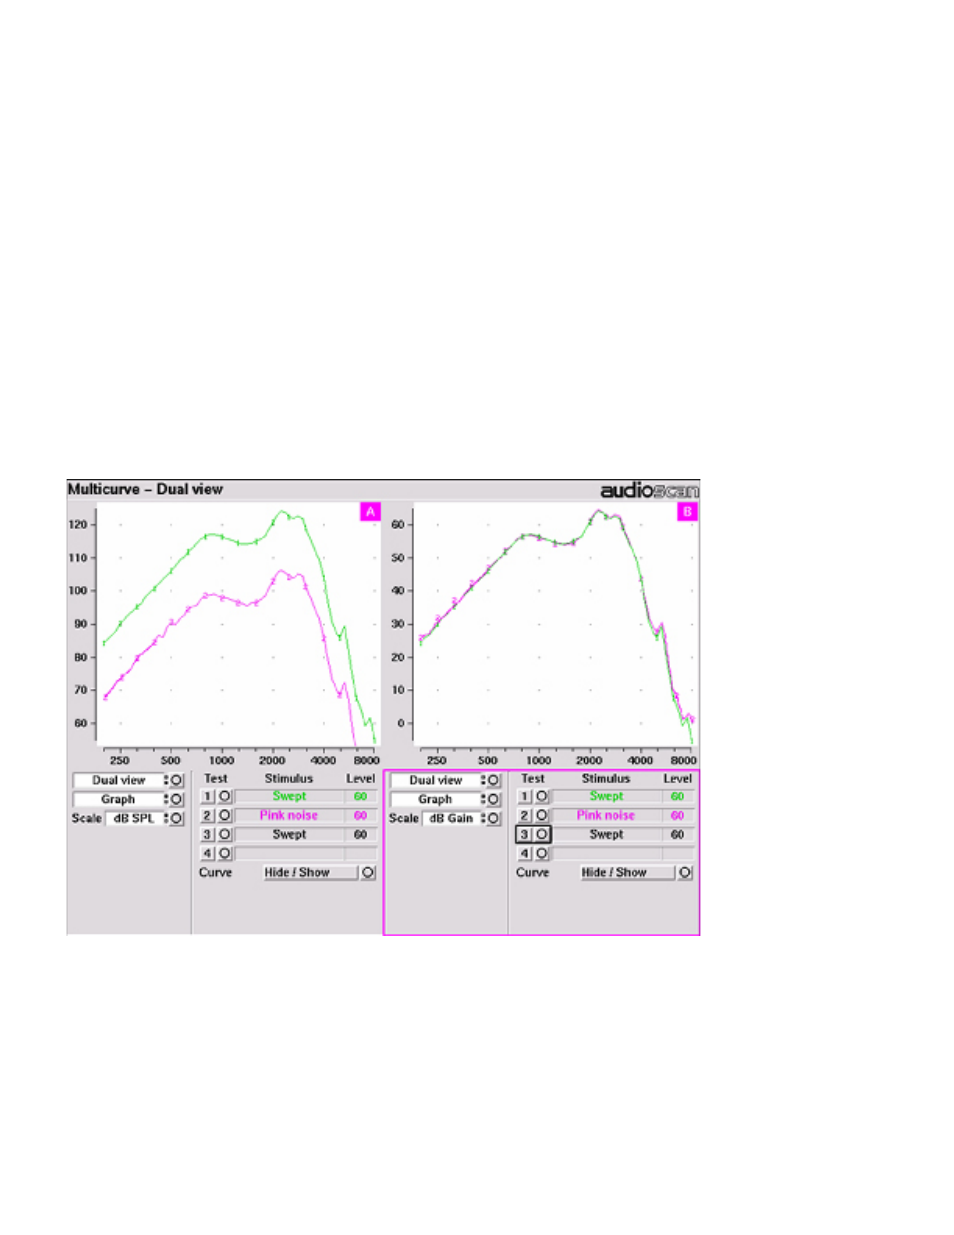
For a linear hearing aid, a pink noise stimulus will re-
sult in a response curve that has the same shape as
one obtained using a swept pure tone. However, it
must be remembered that, while a swept tone has
the same band SPL as overall SPL, the band SPL for a
noise signal is significantly lower than the overall SPL.
Consequently, for a linear aid, output curves obtained
using 1/12 octave analysis will be about 18 dB lower
than the output curves obtained using a swept tone
at the same overall SPL. As long as the hearing aid is
linear, the gain obtained will be the same for both sig-
nals. Figure 8 shows output (A) and gain (B) for a lin-
ear hearing aid, obtained using a swept tone (1) and
pink noise (2) with a 60 dB overall SPL.
3.2 Real-speech signal analysis
One of the most-used measures of a speech signal is
the long-term average speech spectrum (LTASS). This
is a 1/3 octave spectrum averaged over a sufficiently
long portion of the speech material to provide a sta-
ble curve. In practice a 10 second average meets this
requirement and, for this reason, all Speechmap pas-
sages are at least 10 seconds long. The LTASS curves
displayed in Speechmap are 1/3 octave band levels
at 1/12 octave intervals. It should be noted that this
results in smoothing and the apparent broadening of
the spectrum of a narrow-band signal. For example a
1/3 octave band of speech will exhibit a spectrum 2/3
octave wide.
The dynamic nature of speech is often characterized
by the distribution of short-term levels in each 1/3
octave band. Historically, time periods of 120, 125 or
128 ms have been used. In Speechmap, 1/3 octave
band levels at 1/12 octave intervals are derived ev-
ery 128 ms. The level in each band that is exceeded
by 1% of the samples (called L1, or 99th percentile)
has historically been referred to as the speech peak
for that band. The curve for these L1 levels is approxi-
mately 12 dB above the
LTASS. The level in each
band that is exceeded
by 70% of the samples
(called L70, or 30th per-
centile) has historically
been called the valley
of speech for that band.
The curve for these L70
levels is approximately
18 dB below the LTASS.
The region between
these two curves is of-
ten called the speech re-
gion, speech envelope
or speech “banana”. The
speech envelope, when
derived in this way, has
significance in terms
of both speech detec-
tion and speech under-
standing.
Generally, speech will be detectable if the L1 level is at
or near threshold. The Speech Intelligibility Index (SII) is
maximized when the entire speech envelope (idealized
as a 30 dB range) is above (masked) threshold. . This will
not be an SII of 100% (or 1) because of loudness distor-
tion factors, but higher SII values will not produce sig-
nificantly higher scores on most test material.
Figure 8: Output (left) and Gain (right) curves for a linear hearing aid, generated
using a swept tone (1) and pink noise analyzed in 1/12 octave bands (2). (Dual
view not available in RM500SL)
8