Trending graph buttons, Temperature trending and temperature data buttons, Limiters and trips – Basler Electric IDP-1200 User Manual
Page 25
9437200990 Rev C
17
Trending Graph Buttons
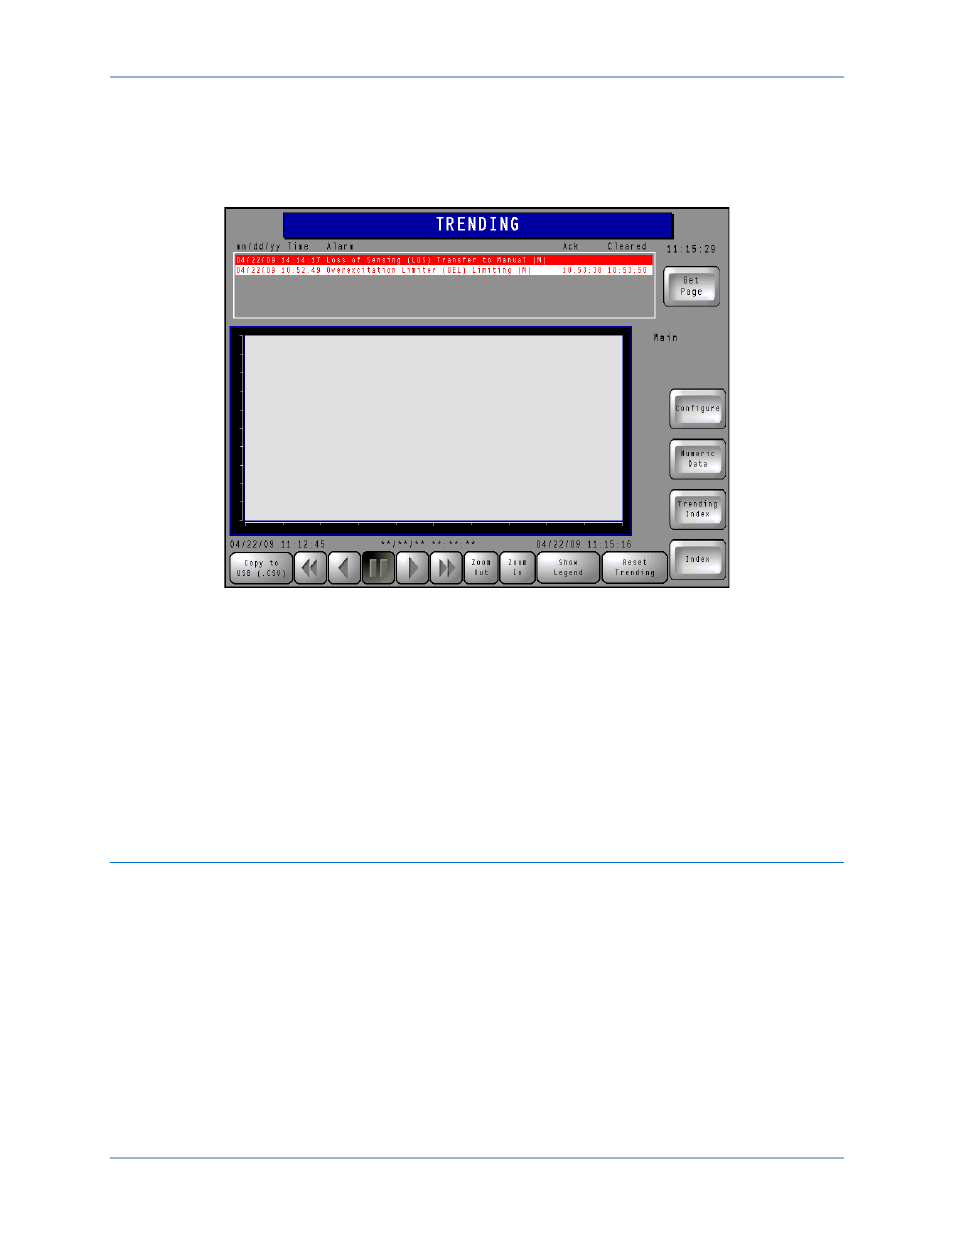
Pressing these Trending Index screen buttons accesses the corresponding trending graph page (either
the Main channel trending graph or the Redundant channel trending graph). The Main channel trending
graph screen (Figure 17) is shown here; the Redundant channel trending graph screen is identical in
appearance.
Figure 17. Main Channel Trending Graph Screen
Each trending graph screen has a graph window with buttons that are used to move forward and
backward through the plot, zoom in and out, and reset the plot. Plotted parameters are selected on the
Meter Trending Configuration screen. Pressing the Show Legend button displays a legend indicating the
line colors and patterns used in the trending graph. A Copy to USB button provides the ability to export
the plot data to the IDP-1200’s USB port in a comma-separated-values file format.
Temperature Trending and Temperature Data Buttons
These Trending Index screen buttons are pressed to access a plot or list of temperature data for the
rectifier bridges. Display and control layout of these pages are identical to that of the trending data and
trending graph screens for the control system channels.
Limiters and Trips
This page (Figure 18) indicates the status of the following limiters and trip actions:
•
Overexcitation (OEL)
•
Volts per Hertz (HXL)
•
Overvoltage (OVL)
•
Instantaneous (INST)
•
Minimum Excitation (MEL)
•
Underexcitation (UEL)
•
Loss of Sensing (LOS)
•
External Initiated Lockout (86)
•
Transformer Overtemperature (OTT)
•
Loss of Both Cooling Fans (LBF)
Pressing the Acronym Key button displays a list of acronym definitions for the Limiters & Trips page.
IDP-1200
IDP-1200 Operation with ECS2100 and ECS/RW