Genee World ClassComm User Manual
Page 34
34
-
Add the mapped activity into ClassComm (See Phase 2 of this guide for information on how
to do this).
-
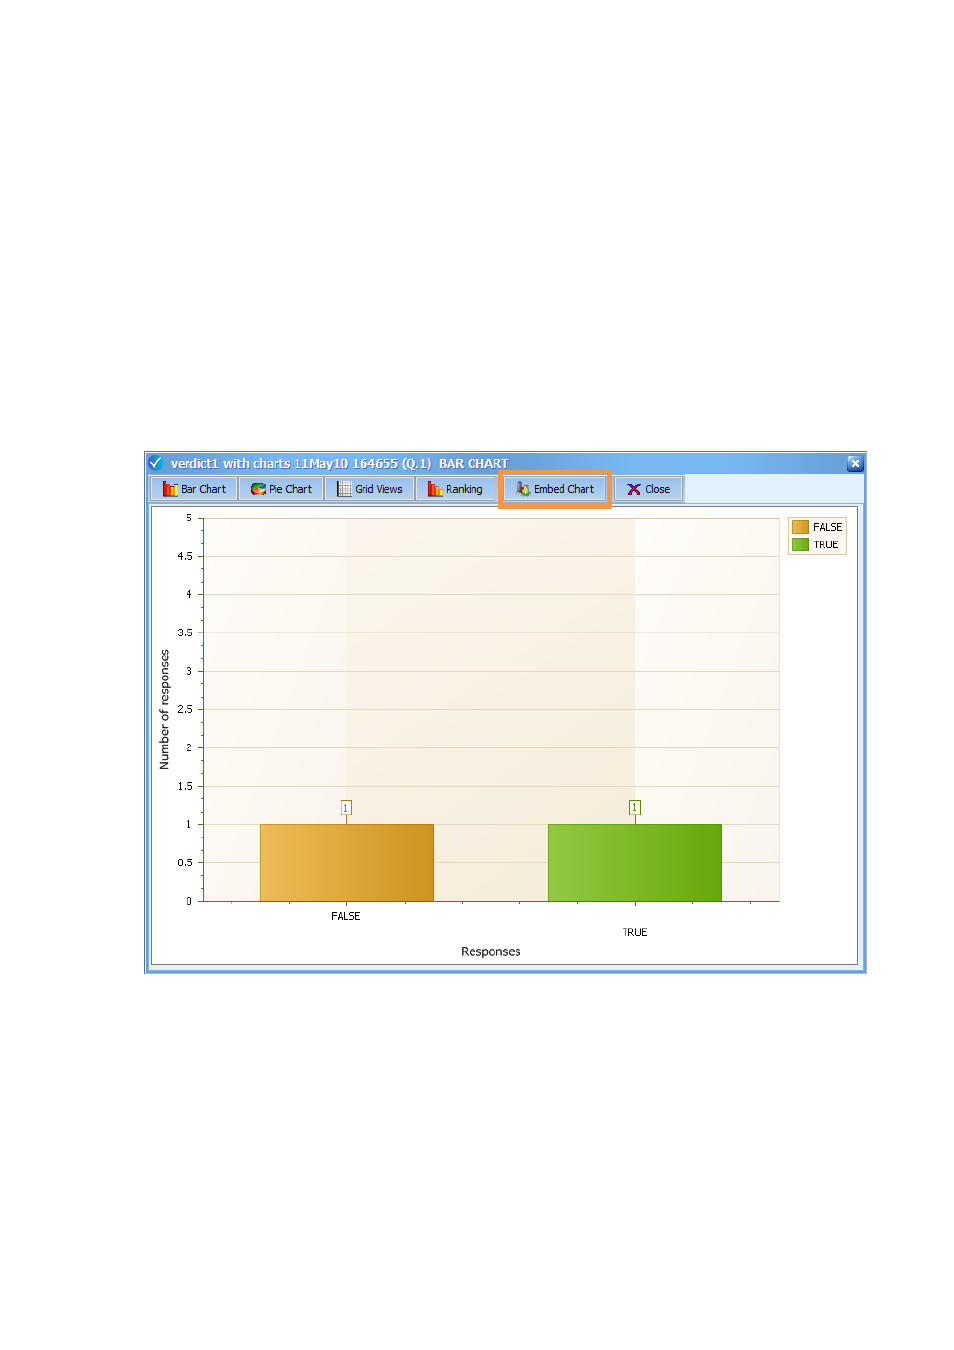
Run the presentation and after responses have been taken and the question stopped, press
the graph button from the teacher handset or the presentations toolbar. Notice that an
“Embed Chart” button has become enabled (See image below).
-
Select the chart or results grid that you wish to add to the slide and click “Embed Chart”.
The selected chart or grid will drop into the previously mapped chart container.
-
When the presentation is completed, a Save As window will appear. Name and save the
presentation. This will not affect the original, mapped PowerPoint Activity in ClassComm. It
will save as a separate PowerPoint (ppt) file that can be opened and reviewed with the
embedded charts.
After a presentation has been completed, saving the presentation will close the PowerPoint
slideshow view and the ClassComm software interface will re-open.