3 disturbances, 1 disturbance wave shape, Isturbances – CIRCUTOR AR6 Series User Manual
Page 38: Disturbance wave shape
AR6 portable network analyzer
Page 38 of 69
User Manual
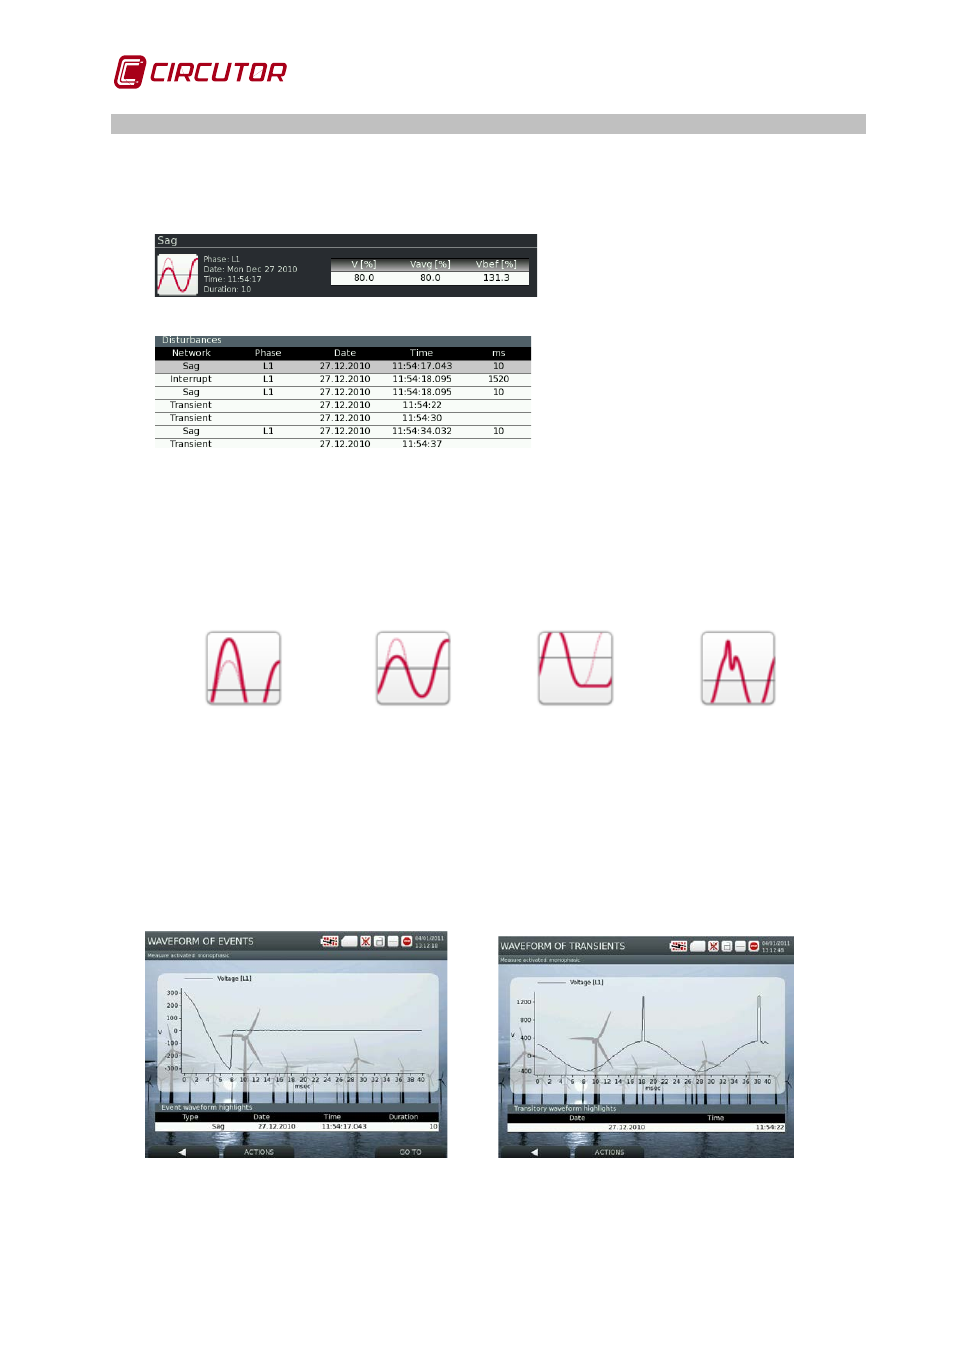
11.3 DISTURBANCES
Disturbances recorded by the analyzer appear on a table, in which a short information about
each one is displayed. The information is preceded by an acknowledgement icon for each
disturbance type and its numerical information as an average voltage value, previous value,
final value and duration.
Fig. 11-3.- Example of the disturbance type icon
Parameters displayed:
•
Different disturbance types detected (the
example shows a table with several
types of records)
•
The phase affected by the disturbance
•
The date and time when the disturbance
occurred.
•
The disturbance duration in milliseconds.
Fig. 11-4.- Example of a disturbance table. In this case the selected one is a sag
The disturbances screen lets the user see several types of disturbances. Each one is identified
with an specific icon. Fig.11-5shows the icons identifying different types of disturbances.
NOTE: The configuration of what is considered to be a disturbance corresponds with the
configuration made by the user for the PHOTO and EVQ events logging configuration page.
SWELL
SAG
INTERRUPTION
TRANSIENT
Fig.11-5.- Various types of disturbances that can be logged
The user can move through the various disturbances displayed in the table by using the ▼/ ▲
navigation buttons. Once the cursor is located over a specific disturbance, it is possible to see
the captured wave shape by clicking the confirmation button
λ
11.3.1 Disturbance wave shape
This is a graphic screen showing the wave shape of the event selected from the table. On this
screen, as with the rest of the graphic screens, it is possible to zoom different areas. The
dynamic key ACTIONS , opens a menu to Zoom IN or OUT any zone of the graph.
Fig.11-6.- Examples of wave shape screens