18 screen information, 1 upper bar icons, Screen information – CIRCUTOR AR6 Series User Manual
Page 55: Pper bar icons
AR6 portable network analyzer
User Manual
Page 55 of 69
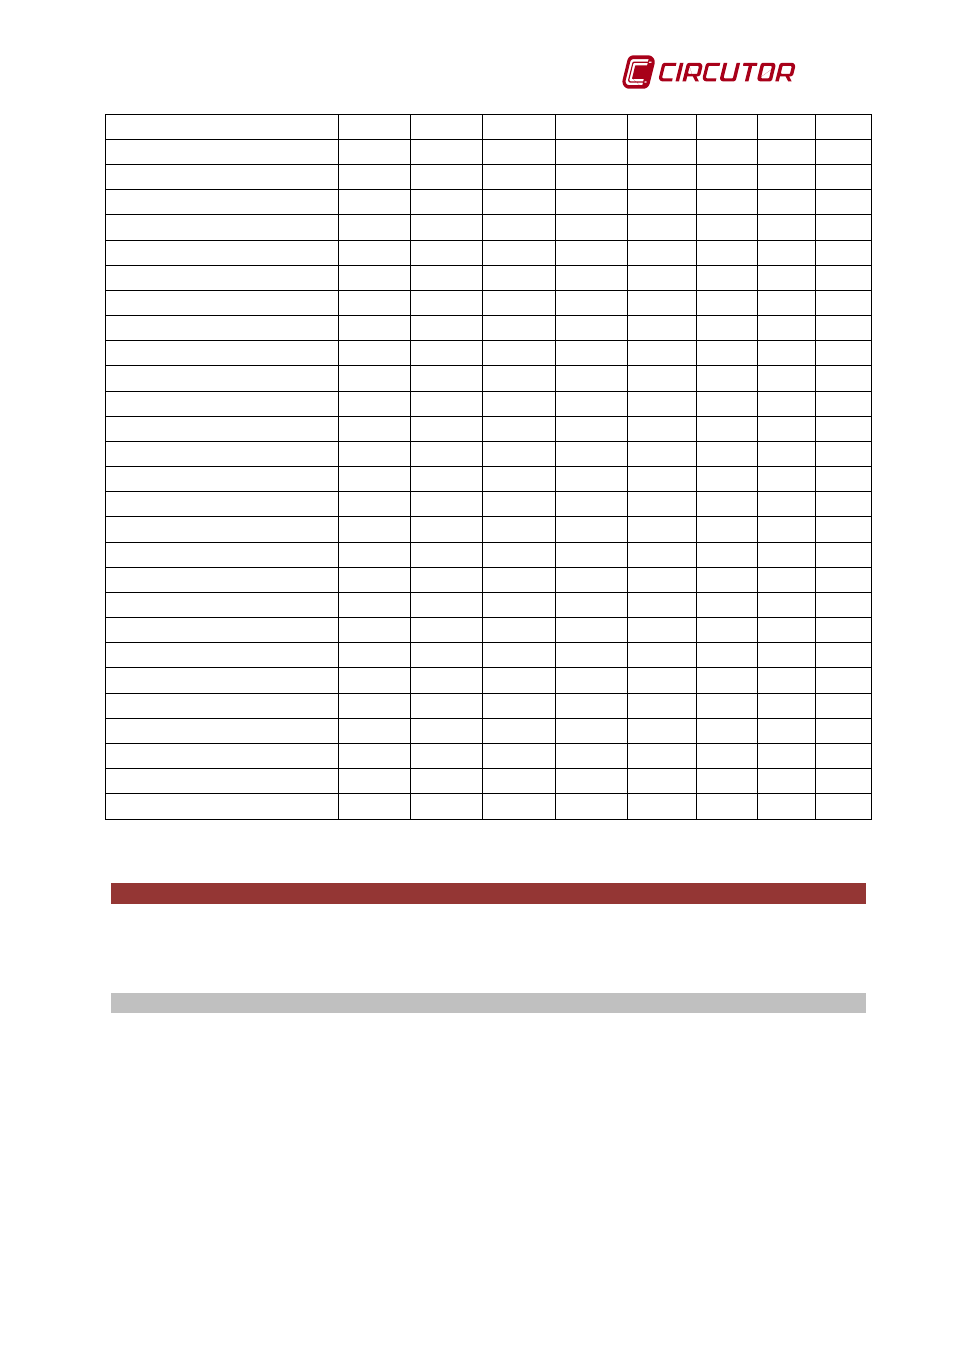
Voltage THD even
Voltage THD odd
Current THD
Current THD even
Current THD odd
Inst. Flicker (WA)
PST Flicker
Frequency
Voltage Imbalance
Voltage Asymmetry
Current Imbalance
Current Asymmetry
Voltage Harmonics (1-50)
Current Harmonics (1-50)
Active Power Maximum Demand
Apparent Power Maximum Demand
Average Current Maximum Demand
Current L1, L2, L3 Maximum Demand
Consumed Active Energy
Consumed Inductive Energy
Consumed Capacitive Energy
Consumed Apparent Energy
Generated Active Energy
Generated Inductive Energy
Generated Capacitive Energy
Generated Apparent Energy
Wave shapes
Phasor representation
(*) The cosine and power factor angles have a default value of 1 if there are no variables for their calculation
18 SCREEN INFORMATION
Information about the analyzer screen and location of the various icons that appear on the
upper bar of the analyzer menu are described below. Some icons change status based on
programming, recording, memory or battery conditions.
18.1 UPPER BAR ICONS
The icons on the upper part of the screen indicate the status of the unit and are present on all
screens. Each one's location on the screen and a brief description is shown in the figure