TE Technology TC-720 User Manual
Page 61
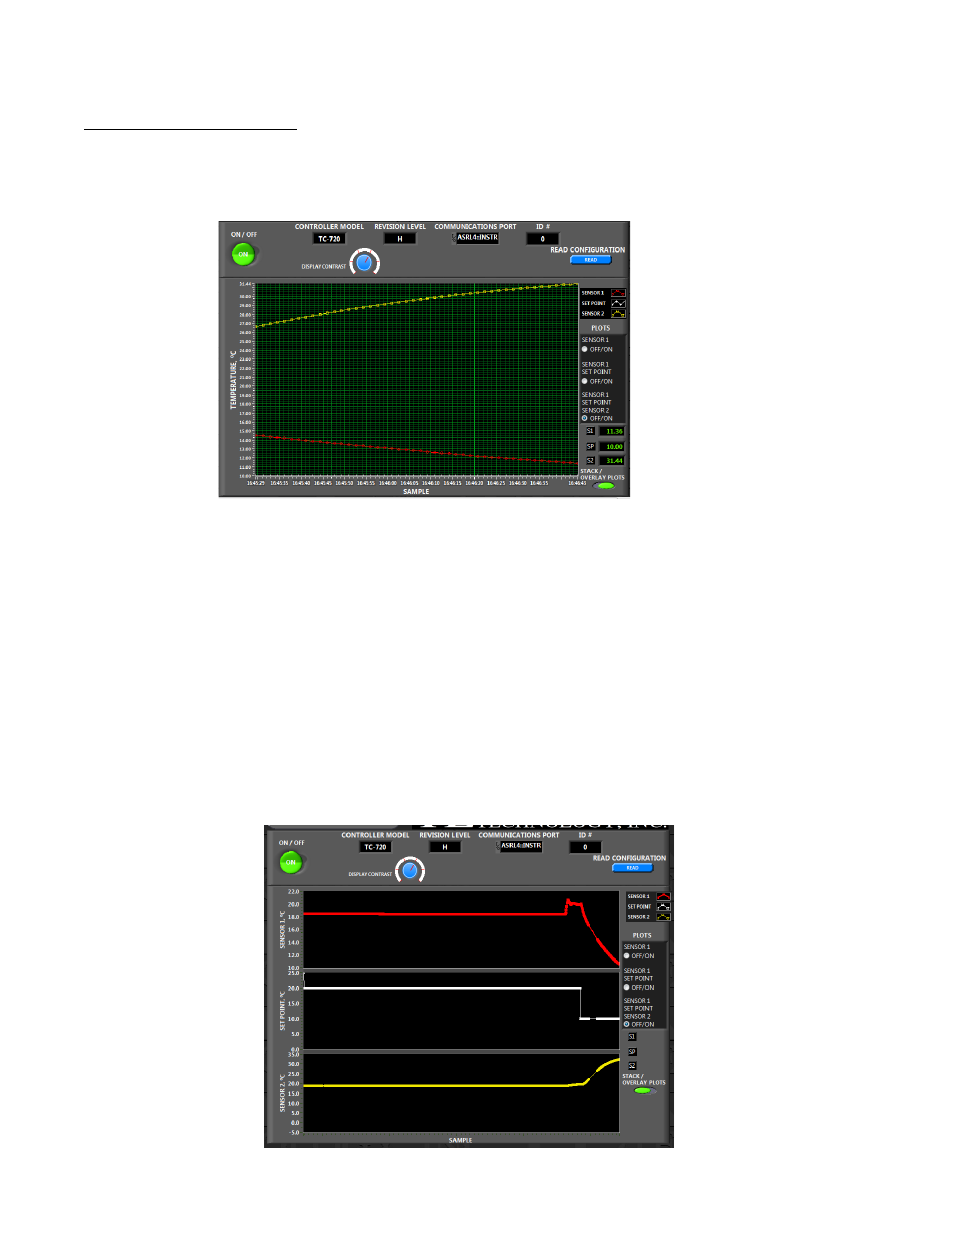
SENSOR AND SET POINT DISPLAY
The sensors and set point values are displayed on a waveform graph. The STACK/OVERLAY PLOTS button toggles between
how the sensors and set point values are displayed. The graph below shows the plots in overlay mode where all the plots
share a common Y-axis.
In the PLOTS section, if SENSOR1 is selected, then only the control sensor is plotted. If SENSOR 1/SET POINT is selected,
then the control sensor and the set point temperature are plotted. Lastly, when SENSOR 1/SET POINT/SENSOR 2 is selected
(as shown in above), the control sensor, set point temperature, and secondary sensory are plotted.
In the graph shown above, the set point temperature was set to 10 °C. This is actually being plotted but the Y-scale starts at
10 °C, so the plot does not show up very well. You can right-click on the Y-axis with the mouse and deselect “AutoScale Y”.
Then you could highlight the number at the bottom of the Y-axis and enter a lower number to more clearly display the plot
if needed.
In the lower right corner of the graph up above the STACK/OVERLAY toggle switch, the current sensor values and set-point
temperature are shown. The S1, or sensor 1, is the control sensor temperature. The SP is set point temperature. S2, or
sensor 2, is the secondary sensor temperature.
In the STACK mode, the graphs are displayed individually as shown below. This set up provides individual Y-axes for each
plot. NOTE: Right clicking in the graph brings up a menu of useful options, such as exporting data to Microsoft Excel.
61