Appendix c – programming custom sensor curves – TE Technology TC-720 User Manual
Page 92
Appendix C – Programming Custom Sensor Curves
Hardware operation:
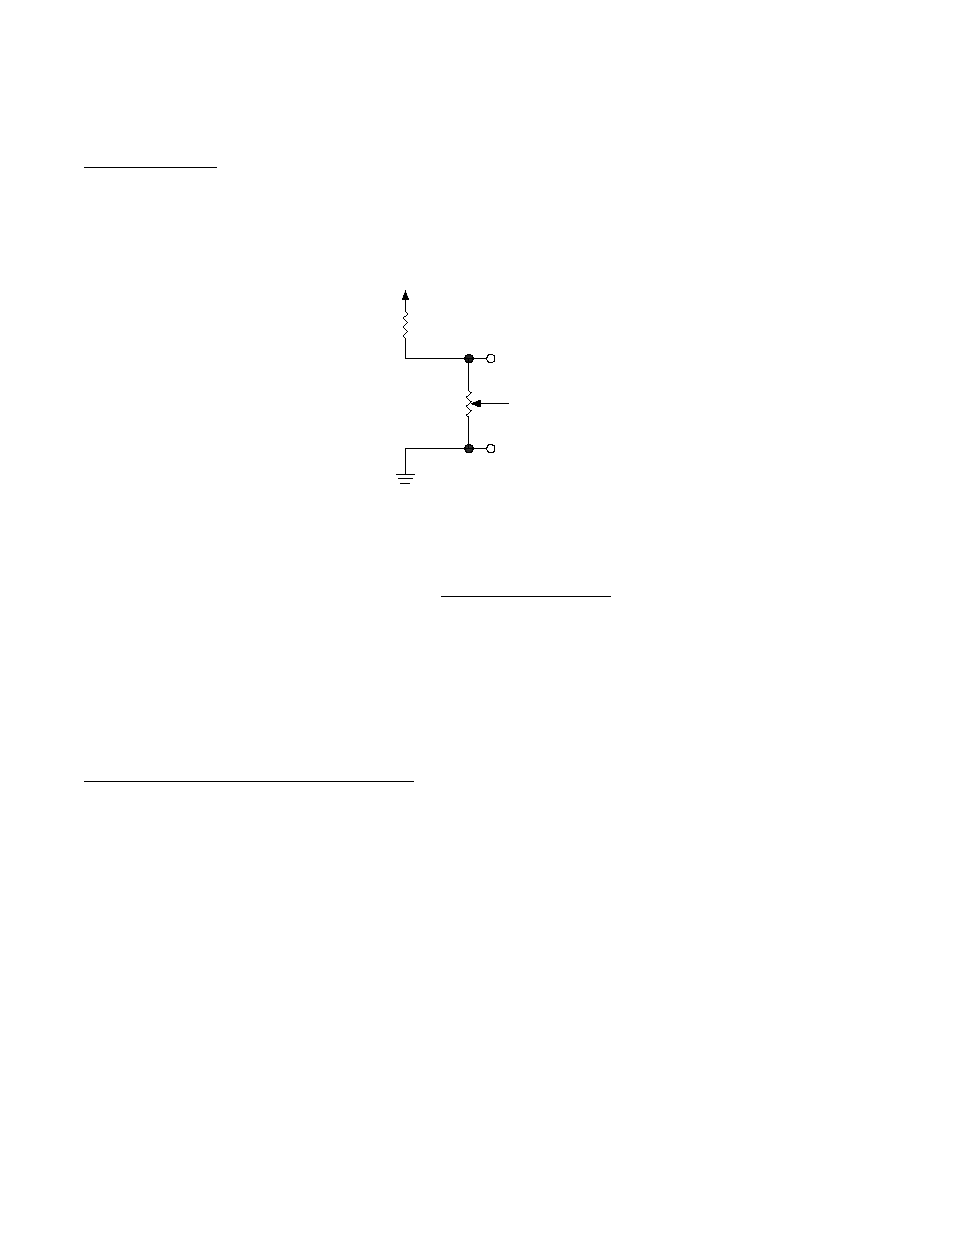
First let’s look at the controller’s sensor circuitry. Sensors are connected to JP2 at terminals 1 and 2 (control sensor), and 3
and 4 (secondary sensor). Each sensor is in series with a 6650 ohm resistor that forms a voltage divider.
The voltage at JP2-1 and JP2-2 (or JP2-3 and JP2-4) can be calculated with the formula:
Ω
+
Ω
Ω
=
_
6650
_
5
SENSOR
SENSOR
V
V
SENSOR
The controller then reads the voltage using a 16 bit digital-to-analog (D-A) converter for each sensor input. The
temperature resolution that is measureable with the controller is dependent on the voltage change per °C from the sensor.
The minimum voltage change the controller can measure is 5 V 2
16
�
= 5 V 65536
�
= 0.0000763 V. The maximum
temperature resolution of the controller is 0.01 °C. If a temperature change of more than 0.01°C is required to achieve this
minimum voltage change, the controller will not be able to fully resolve temperatures to a 0.01 °C resolution.
Creating A User Defined Temperature Sensor Curve:
There are several basic steps we have followed for creating a user-defined sensor curve:
1. Create an index column in a spreadsheet program with the numbers 0 through 128
2. Assign a voltage value next to each to each index number, these should span from 0 to 5 V. This represents the
range of sensor voltages as measured by the controller
3. Assign a corresponding temperature value next to each voltage
4. Make a .csv file containing the temperature data only, and upload it to the controller
The following example shows how to create a user defined thermistor curve. We will use the 15k thermistor as our
example. It varies from 146,735 ohms to 1014 ohms over the temperature range of -20 °C to 100 °C. We can determine the
extreme values for the sensor voltage. This is 4.78 V at 146,735 ohms, and 0.66 V at 1014 ohms.
There are 129 locations in the array corresponding to voltages ranging from 0 to 5 V. Consequently, the voltage for each
index (5 V/128 = 0.039 V per increment) is shown in the VOLTAGE column in table below. The temperature corresponding
to each voltage can then be entered at the corresponding index location. For index voltages above and below the sensor
maximum and minimum voltages, the corresponding maximum and minimum temperatures are used. The table below
shows the temperatures that correspond to each index location for our example 15k thermistor.
JP2-1 or -4
JP2-2 or -3
thermistor or other
temperature sensor
6650 ohm
+5 V
92