CIRCUTOR CVM-B Series User Manual
Page 90
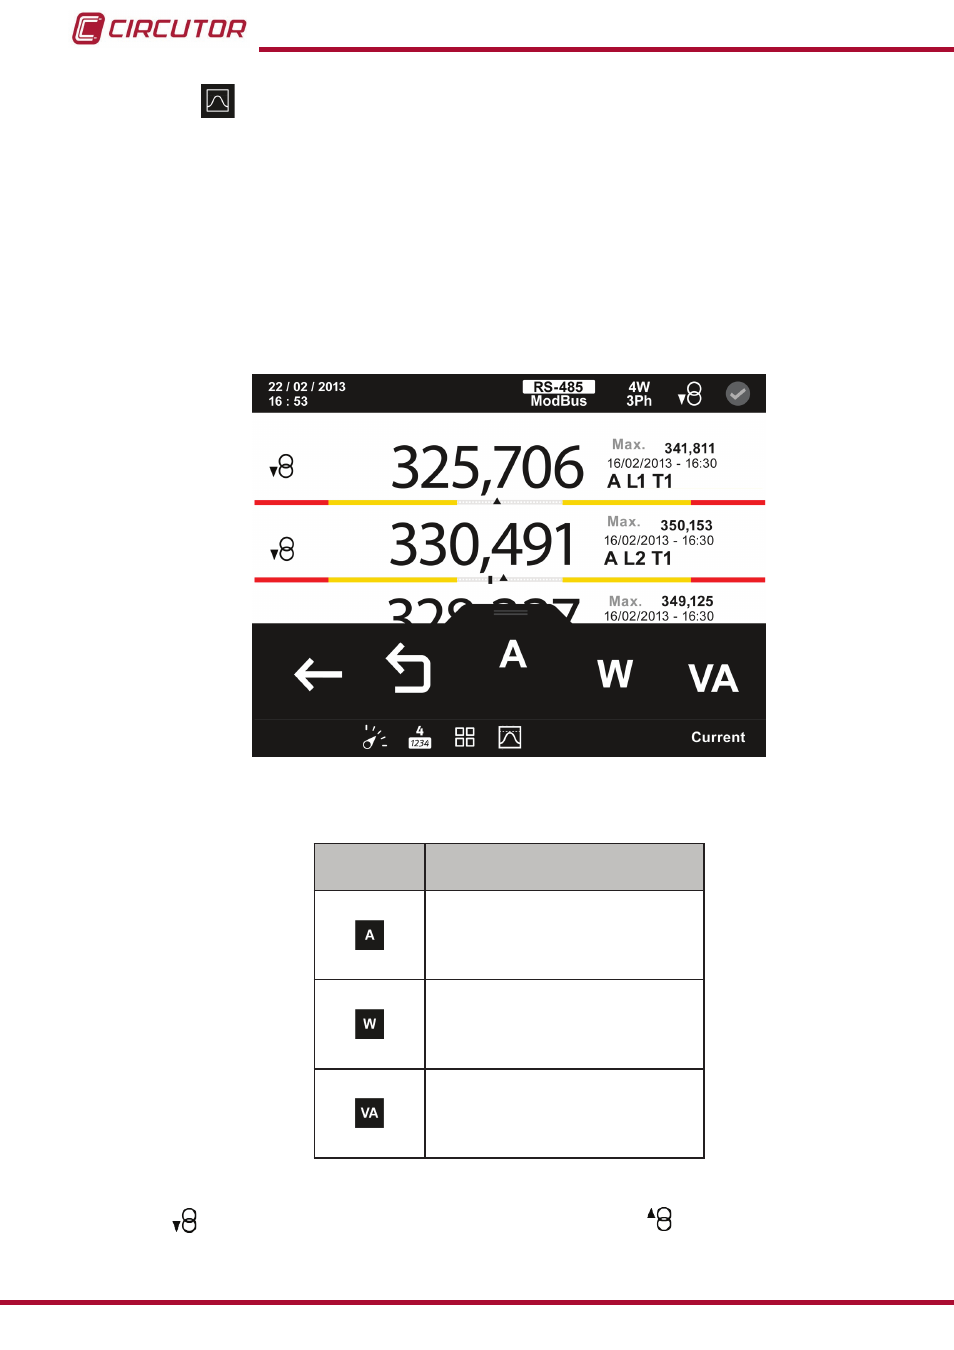
5�1�3�1�3�-
Demand parameters�
On this screen,
figure 74
, you can view all the maximum demand parameters indicated in
Table 19.
For each of the demand parameters you can view:
The value for each tariff, T1, T2 and T3.
The maximum value, with the date and time when it occurred.
A bar chart with the indications of the instantaneous value, maximum and minimum
values and alarms, see
figure 74:Demand parameters (display 4 parameters)�
Table 19:Demand parameters (display 4 parameters)�
Icon
Display 4 parameters
Demand parameters
Current L1
Current L2
Current L3
Current III
Active power L1
Active power L2
Active power L3
Active power III
Apparent power L1
Apparent power L2
Apparent power L3
Apparent power III
The following icons appear for all these parameters on the screen:
Indicating that the parameter refers to consumed or
generated energy.
If the 2 icons light up at the same time, it means the installation is not properly connected.
90
CVM-B100 - CVM-B150
Instruction Manual