Grass Valley iControl V.4.43 User Manual
Page 442
Alarms in iControl
Example — Monitoring a Virtual Alarm
432
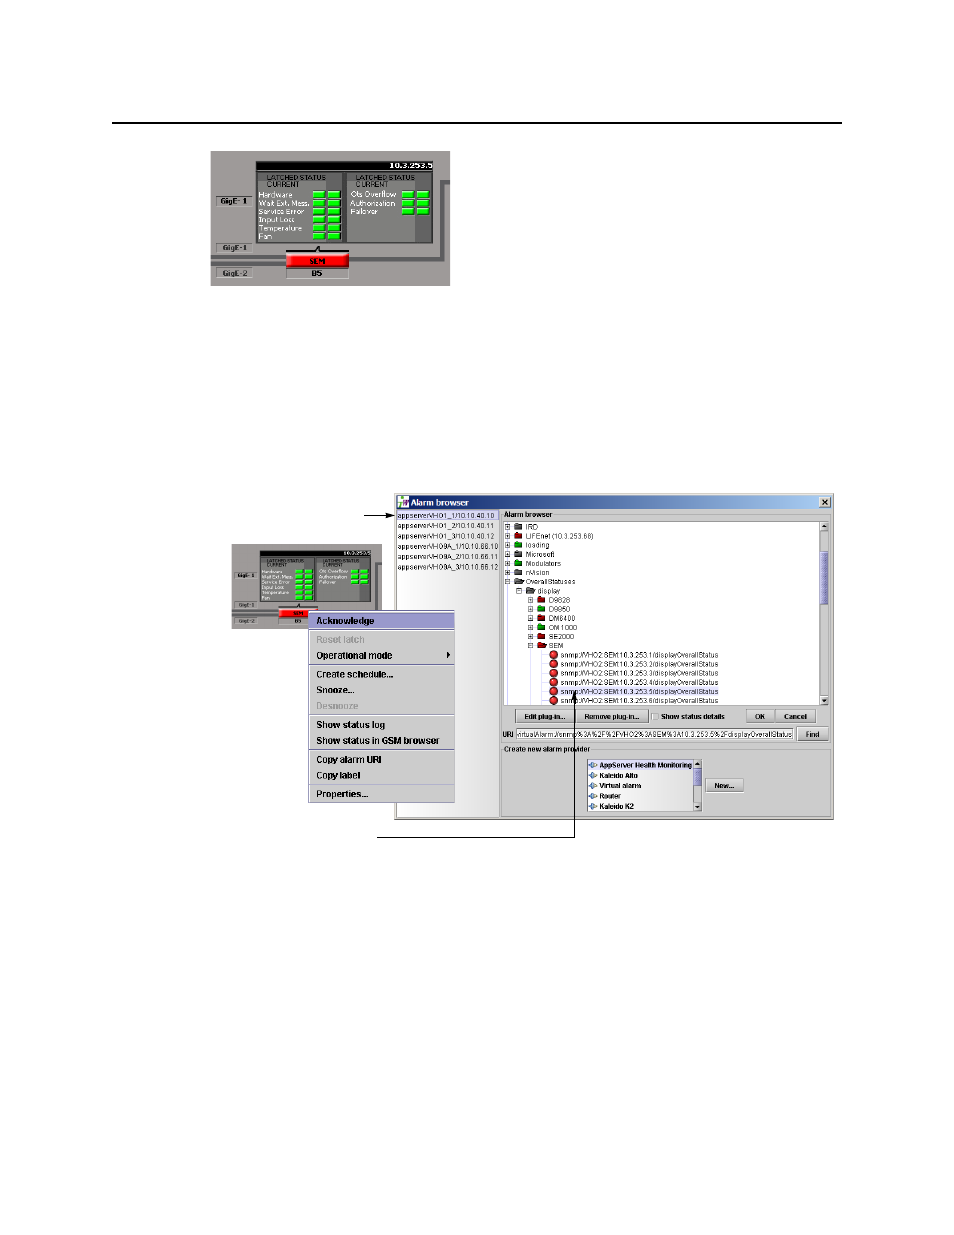
The SEM is represented by a button that corresponds to
a virtual alarm with several sub-alarms. Some of the sub-
alarms are displayed in a panel on the Web page
(Hardware, Temperature, Fan etc.). The panel shows
the current and latched statuses of these sub-alarms,
while the button shows the overall status of the SEM
virtual alarm.
The button is red, indicating a problem with the SEM. But the status panel is all green,
indicating that the problem must come from another source. Here’s how to go about tracking
the problem down:
To track the problem
1. Right-click the SEM button, and then select Show status in GSM browser from the drop-
down menu.
The GSM Alarm browser window appears, with the virtual alarm highlighted (the GSM
running the SNMP plug-in instance for this particular SEM is also highlighted).
Figure 7-113
2. Click Edit plug-in.
The Build virtual alarm window appears, revealing the setup of the SEM virtual alarm,
including a list of its sub-alarms. In this case, the Primary GigE sub-alarm is red—this is the
likely source of the problem.
GSM associated with
the SEM virtual alarm
SEM virtual alarm