Rf chart grapher] tab – Sony Underwater Housing for Select RX100-Series Cameras User Manual
Page 34
34
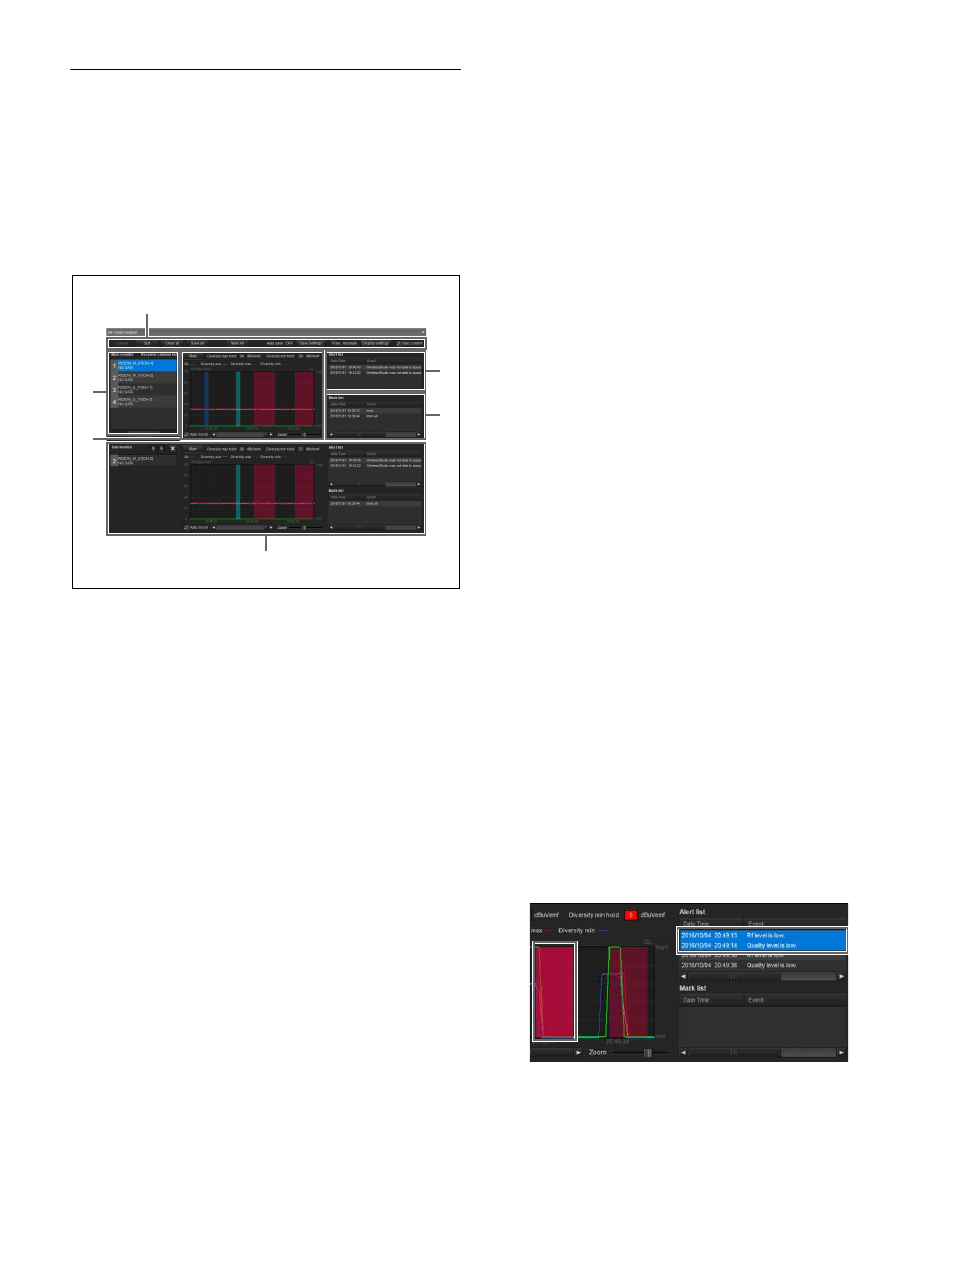
[RF Chart Grapher] Tab
You can use the [RF Chart Grapher] in Wireless Studio to
record information on the signal environment and any
alerts that occurred during operation. This allows you to
determine the cause-and-effect relationship between the
signal environment and specific alerts.
By specifying a receiver channel as a sub monitor channel,
you can view graphs for multiple receiver channels
simultaneously on a single screen.
a
Control items
Capture
: Starts acquisition and graph display of RF and
QL data for all receiver channels displayed in the receiver
channel list.
Quit
: Stops acquisition and graph display of RF and QL
data for all receiver channels displayed in the receiver
channel list.
Clear all
: Clears the RF and QL data acquired for all
receiver channels displayed in the receiver channel list and
clears the graph display.
Save all
: Saves the RF and QL data acquired for all
receiver channels displayed in the receiver channel list to
a file.
Mark all:
Allows you to add memos to the graphs of all
the receiver channels displayed in the receiver channel list.
For details, see “Mark function” on page 37.
Auto save
: Indicates whether the signal environment
status obtained via the [RF Chart Grapher] for each
receiver channel is automatically saved.
Save settings
: Click this button to open the [Save settings]
screen. You can configure the timing for automatic saving
and the save destination in the [Save settings] screen.
For details, see “[Save settings] screen” on page 37.
Time
: Indicates the display mode of time information.
Display settings
: Click this button to open the [Display
Settings] screen. The [Display Settings] screen allows you
to configure display settings for RF level, alert, QL, and
time.
For details, see “[Display Settings] screen ([RF Chart
Grapher], [RF Chart Analyzer])” on page 36.
Sync control:
Select this checkbox to sync the scrolling
and zoom controls for the graphs of all the displayed
receiver channels.
b
Main monitor area
Receiver channel list
: Displays a list of receiver channels.
The information of the receiver channel selected here is
displayed in the graph display area, alert list, and mark list.
Add chart
: Click this button to specify the receiver
channel selected in the receiver channel list as a sub
monitor channel.
c
Graph display area
Displays the monitoring results for the signal environment
selected in the receiver channel list as a graph.
Mark
: Allows you to insert memos into the graph.
For details, see “Mark function” on page 37.
Diversity max hold
: Displays the maximum diversity
value for the RF data displayed in the graph.
Diversity min hold
: Displays the minimum diversity
value for the RF data displayed in the graph.
Auto Scroll
: Select this checkbox to scroll the graph
automatically to always display the most recent data.
Zoom
: Zoom in or zoom out on the graph.
Scroll bar
: Scrolls across the time axis.
d
Alert list
Displays problems that occurred during signal
environment monitoring.
When a problem occurs, a portion of the graph display area
will be displayed in red. When you click the red portion,
the corresponding portion in the alert list will be
highlighted.
The messages that appear in [RF Chart Grapher] are as
follows.
If there are items for which the lighting of the ALERT
indicator has been disabled on a receiver, the
corresponding warning messages will not be displayed. To
1
6
2
3
4
5