Sony Underwater Housing for Select RX100-Series Cameras User Manual
Page 36

36
To specify using the status viewer and simple
status viewer
1
Right-click a receiver channel in the status viewer, and
select [Add to sub monitor for RF Chart Grapher] in
the context menu that appears.
The selected receiver channel is displayed in a sub
monitor.
2
Select a different receiver channel in the main monitor
area’s receiver channel list.
The information of the selected receiver channel is
displayed in the right side of the main monitor area.
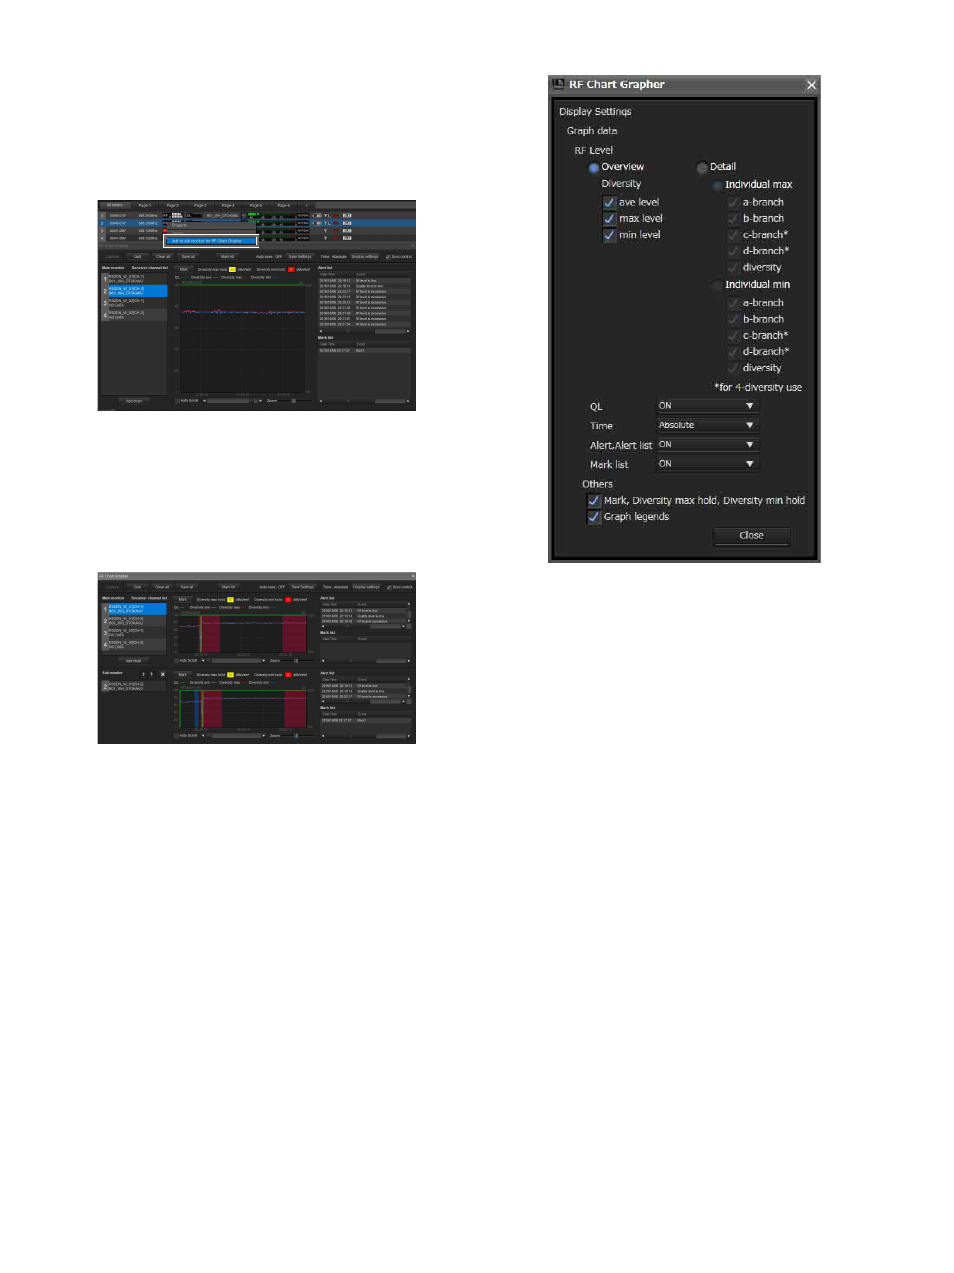
[Display Settings] screen ([RF Chart
Grapher], [RF Chart Analyzer])
As both excessively high and excessively low RF levels
can result in audio loss, appropriate levels must be
maintained. You can switch between RF level displays in
the [RF Chart Grapher] screen to monitor whether proper
RF levels are maintained.
You can also configure how alert, mark, QL, and time
information are displayed on the graph as well as how the
[Mark] button, RF information, and graph legend are
displayed.
[RF Level]
Specify the method of RF level monitoring.
Overview
: Monitors the RF level for the selection made
under [Diversity]. This display mode allows you to
monitor excessively high and low RF levels. You can
specify what to monitor by selecting or clearing the [ave
level], [max level], and [min level] checkboxes.
Detail
: Monitors RF levels by antenna. This allows a more
detailed monitoring of RF levels when compared to
[Overview] mode. The [Individual max] display mode is
used for monitoring excessively high RF levels. The
[Individual min] display mode is used for monitoring
excessively low RF levels. For either display mode, you
can specify what to monitor by selecting or clearing the
[a-branch], [b-branch], and [diversity] checkboxes.
In addition, when using a DWR-R03D and DIVERSITY is
set to 4-ANTENNA, you can monitor the RF levels for
[c-branch] and [d-branch].
QL
Shows or hides QL information in the graph display area.
Time
Specifies the display mode for time axis in the graph
display area.
Absolute
: Displays the time.
Relative
: Displays the amount of time that has elapsed
from the display start time.
Alert, Alert list
Shows or hides alert information in the graph display area,
and shows or hides the alert list.