Sony Underwater Housing for Select RX100-Series Cameras User Manual
Page 40
40
a
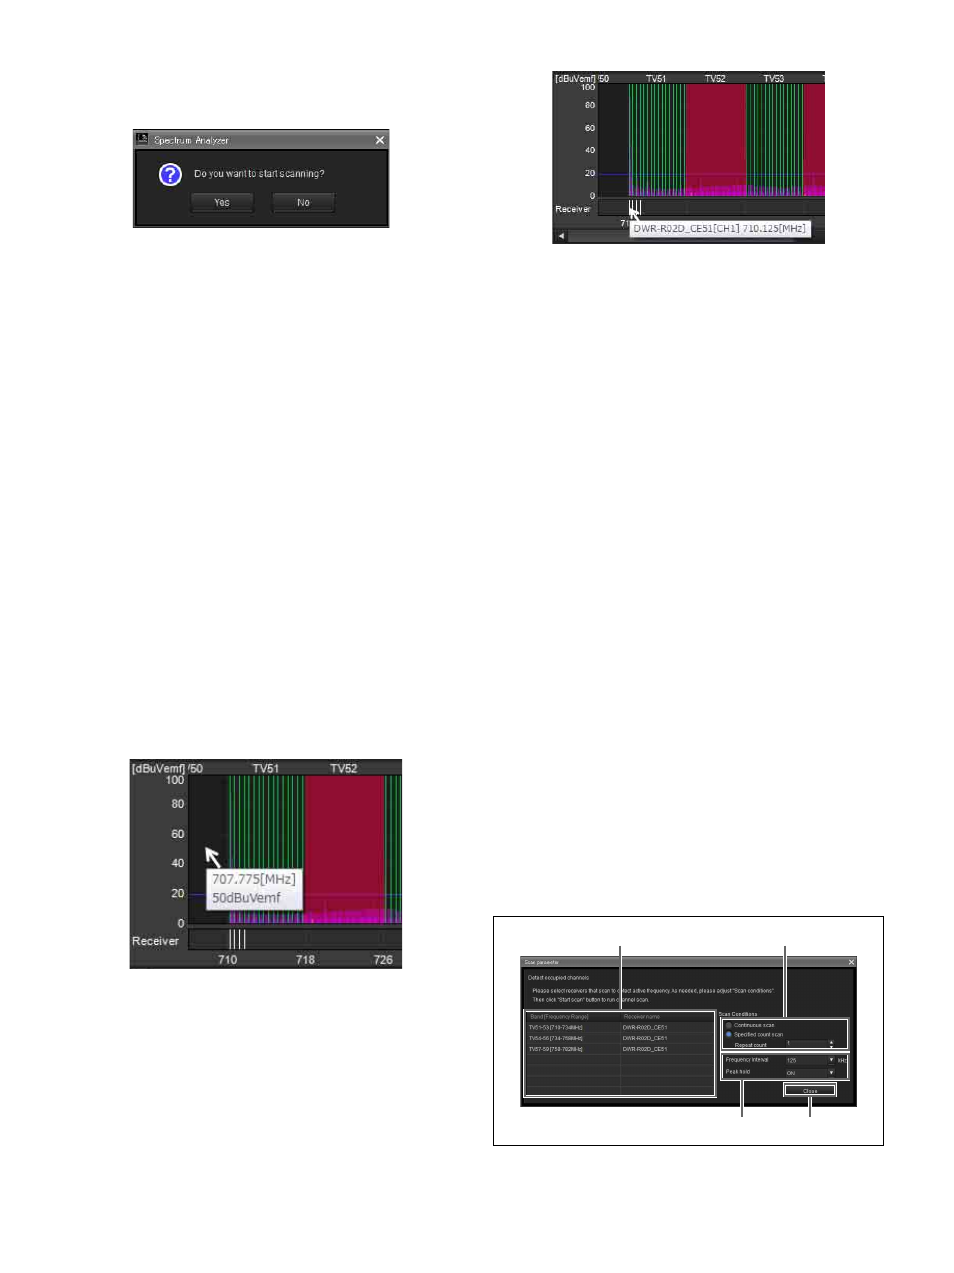
[Start scan] / [Stop scan] button
When you click the [Start scan] button, a confirmation
dialog box appears.
When you click the [Yes] button here, scanning starts and
the button name changes to [Stop scan].
When you click the [Stop scan] button, scanning stops and
the button name changes to [Start scan].
b
[Scan parameter...] button
Allows you to select and configure detailed settings for the
receiver that will perform scanning.
For details, see “[Scan parameter] window” on page 40.
c
[Sleep transmitters while scanning] checkbox
If this is selected, any transmitters that can be controlled
remotely will automatically be set to sleep mode before
scanning starts.
d
Frequency spectrum display area
Many of the items and functions displayed here are
identical to those of [Channel Plan Adviser].
For details, see “[Channel Plan Adviser] Window” on
page 49.
However, the following functions are unique to [Spectrum
Analyzer].
When you place the mouse cursor on the graph, the
frequency and electric field strength is displayed.
The frequencies configured for the receivers are displayed
as white lines in the receiver area. When you place the
mouse cursor on a white line, the receiver name, channel
number, and frequency are displayed.
e
[Scan list]
Displays scanning results in a list after scanning is
complete.
Save button:
Saves the scanning result selected in the scan
list as a file.
Delete button:
Deletes the scanning result selected in the
scan list from the list.
f
[File list]
When you open a scanning results file, the scanning results
stored in the file are added to the list.
Open button:
Displays the dialog box for selecting
scanning results files. The scanning results stored in the
file selected here are added to the file list.
Delete button:
Deletes the scanning result selected in the
file list from the list.
g
Data items
Select the scanning results to display in the frequency
spectrum display area in [Data1] and [Data2].
You can select from [new spectrum], the scanning results
in the scan list and file list, and [Do not display]. When
[new spectrum] is selected, the most recent scanning
results are displayed. When [Do not display] is selected,
scanning results are not displayed.
h
[Top layer]
Select the scanning results that will be displayed on the top
layer of the graph.
[Scan parameter] window
This appears when you click the [Scan parameter...] button
in [Spectrum Analyzer].
1
2
3
4