Occupancy graph report – Comtech EF Data MIDAS Version 4.X Basic Configuration User Manual
Page 115
Advertising
MIDAS 4.2 Basic Configuration, Rev. 0
MIDAS
Reports
3–7
O
O
c
c
c
c
u
u
p
p
a
a
n
n
c
c
y
y
G
G
r
r
a
a
p
p
h
h
R
R
e
e
p
p
o
o
r
r
t
t
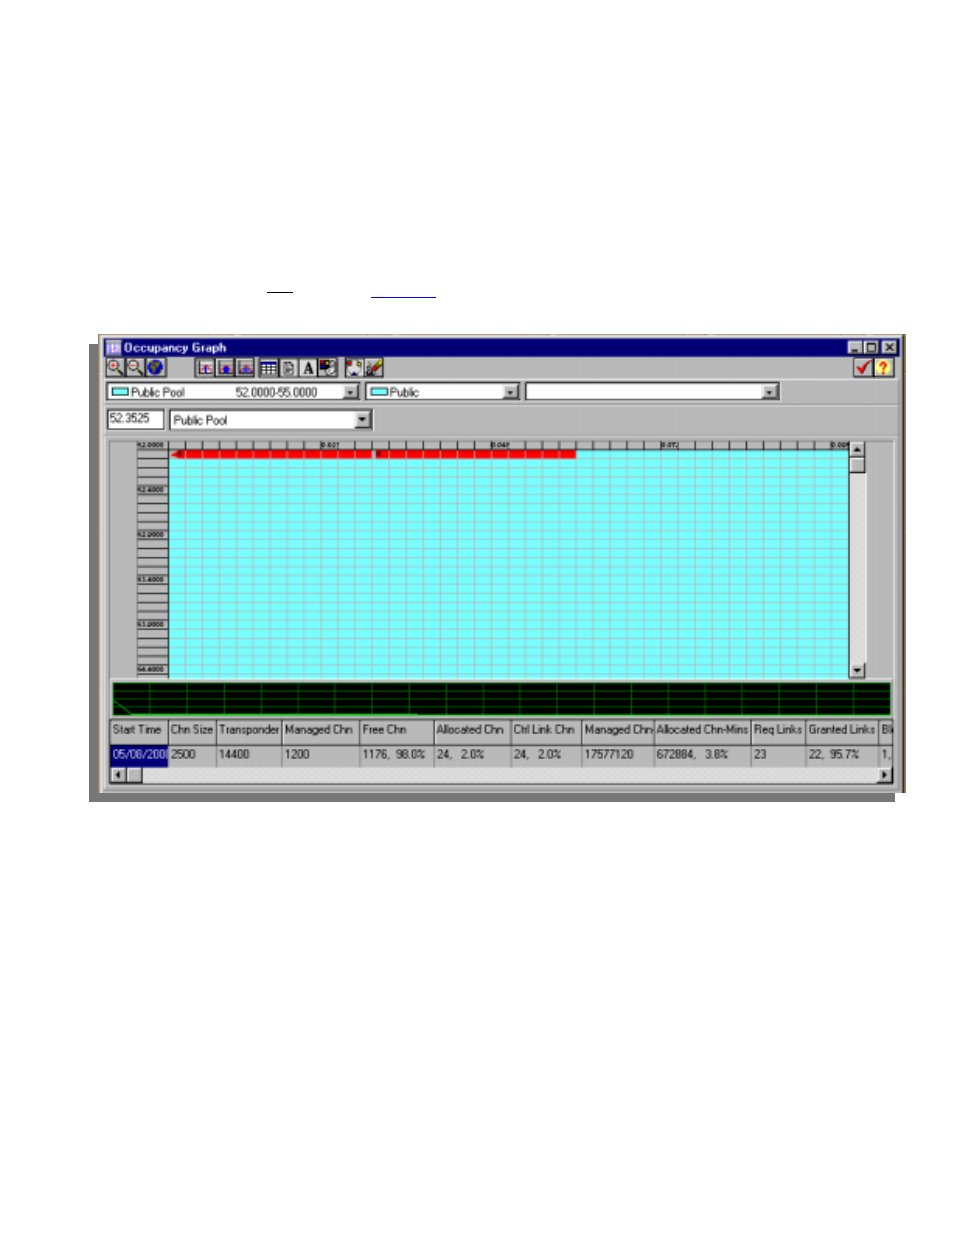
The Occupancy Graph is a view-only representation of the system bandwidth
utilization. The graph is updated every 10 seconds, and the display properties
can be modified according to the operator’s preferences.
See
Chapter 2
, Space Segment, for information about defining the system
bandwidth segment and additional details about this window.
To see the Report Options
pop-up menu, click the right
mouse button.
Advertising
See also other documents in the category Comtech EF Data Equipment:
- CDD-880 (124 pages)
- CDM-800 (130 pages)
- ODMR-840 (184 pages)
- CDM-750 (302 pages)
- CDM-840 (244 pages)
- SLM-5650A (420 pages)
- CTOG-250 (236 pages)
- CDM-700 (256 pages)
- CDM-760 (416 pages)
- CDM-710G (246 pages)
- CDM-600/600L (278 pages)
- CDMR-570L (512 pages)
- CDM-625 (684 pages)
- CDM-625A (756 pages)
- CDD-564A (240 pages)
- CDD-564L (254 pages)
- CLO-10 (134 pages)
- MCED-100 (96 pages)
- CDMR-570AL (618 pages)
- CDM-600 LDPC (2 pages)
- BUC Power Supply Ground Cable (2 pages)
- MPP70 Hardware Kit for CDM-570L (4 pages)
- MPP50 Hardware Kit for CDM-570L (4 pages)
- CDM-625 DC-AC Conversion (4 pages)
- CDM-625 DC-AC Conversion with IP Packet Processor (4 pages)
- DMDVR20 LBST Rev 1.1 (117 pages)
- DMD2050E (212 pages)
- DMD-2050 (342 pages)
- DMD1050 (188 pages)
- OM20 (220 pages)
- QAM256 (87 pages)
- DD240XR Rev Е (121 pages)
- MM200 ASI Field (5 pages)
- DM240-DVB (196 pages)
- MM200 (192 pages)
- CRS-150 (78 pages)
- CRS-280L (64 pages)
- CRS-170A (172 pages)
- CRS-180 (136 pages)
- SMS-301 (124 pages)
- CiM-25/8000 (186 pages)
- CiM-25 (26 pages)
- CRS-500 (218 pages)
- CRS-311 (196 pages)
- CIC-20 LVDS to HSSI (26 pages)