Casella CEL Software for the Microdust dust monitor User Manual
Page 38
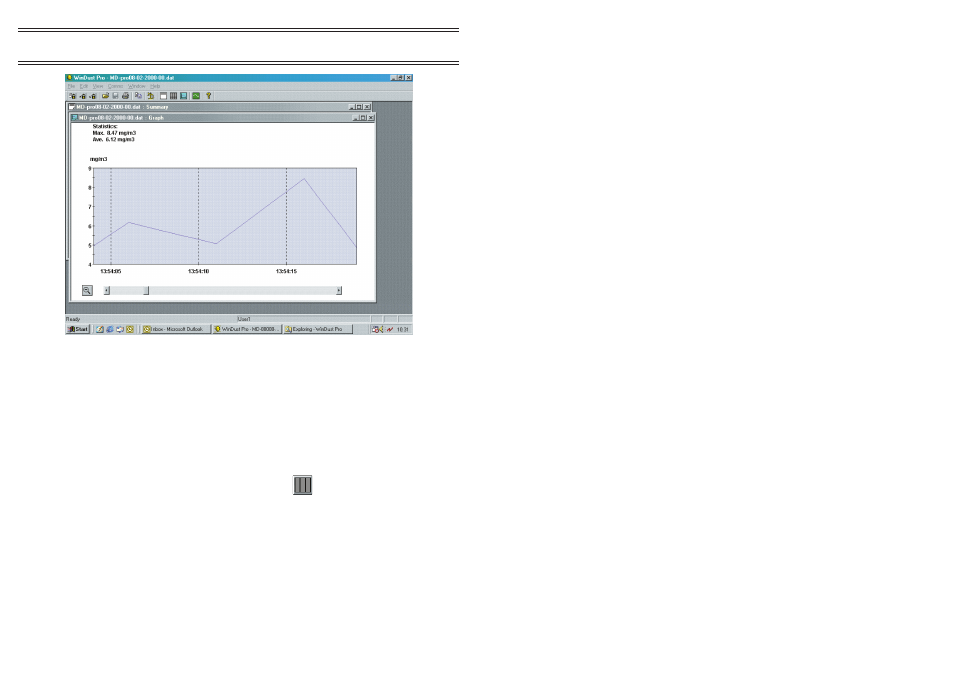
The graph is redrawn with the selected portion expanded to fill the
whole frame (shown in Figure 16).
3.5.3 Displaying Data as a Table
Displaying the information as a table allows you to see the actual values
stored, together with the date & time of their occurrence.
1.
Open the file you want to display as a table, as described in
Section 3.5.1.
2.
Select
Table
from the
View
menu or click
.
A table that includes all of the records in the file will be displayed, as
shown in Figure 17.
3.
Use the vertical scroll bar to move up and down within the table.
3.5.4 Exporting Data to Other Applications
Windust pro data files (
.dat
) can be imported into other applications.
Data files created by WinDust pro are saved as comma delimited ASCII text.
Each set of readings is saved as a single line terminated by a carriage return/
Figure 16: The expanded graph
Page 38 of 60
Application
Software
MICRODUST pro Aerosol Monitoring System &
WINDUST pro Application Software - Handbook