Figure 17 – CIRCUTOR CIRLAMP Series User Manual
Page 23
Advertising
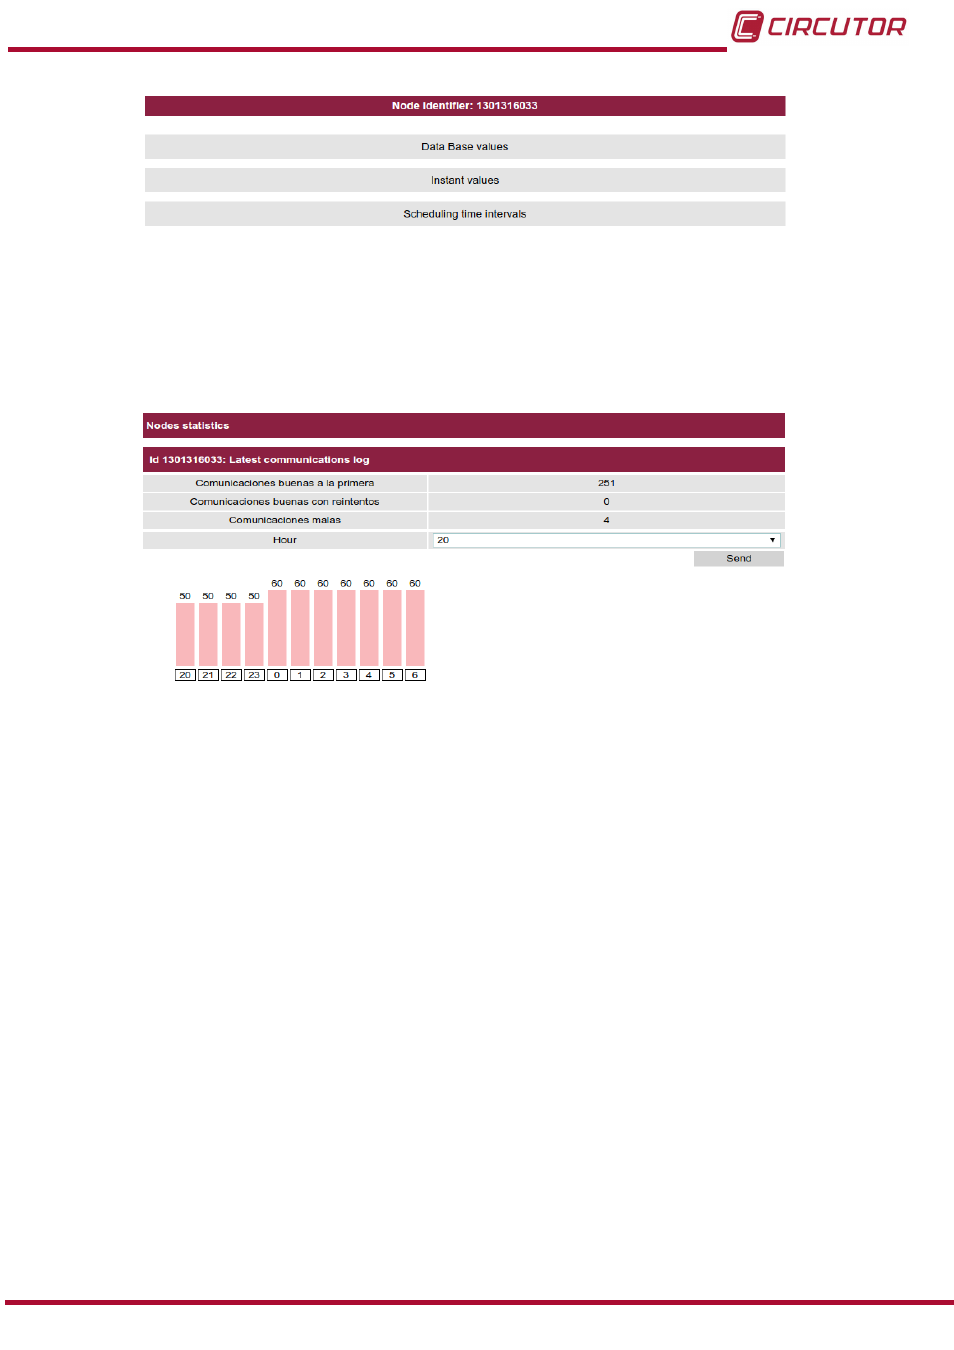
Figure 17:Node information menu (Read access user)�
4�6�3�1�1� Database values
On this screen
you can view the node data for the last 24 hours. You can select any
time on the graph and see instantaneous values for the unit at that time.
Figure 18:Database values screen�
23
Instruction Manual
CirLAMP system
Advertising