Interpreting the gap/mark sensor readings – Formax ColorMaxLP Operator Manual User Manual
Page 42
42
Using the Printer
Formax
The
Enable Virtual Printing
setting will allow you to process your label images without
actually printing in order to determine the amount of ink that will be used during an
actual print. This can be used to help determine the cost of printing a particular label.
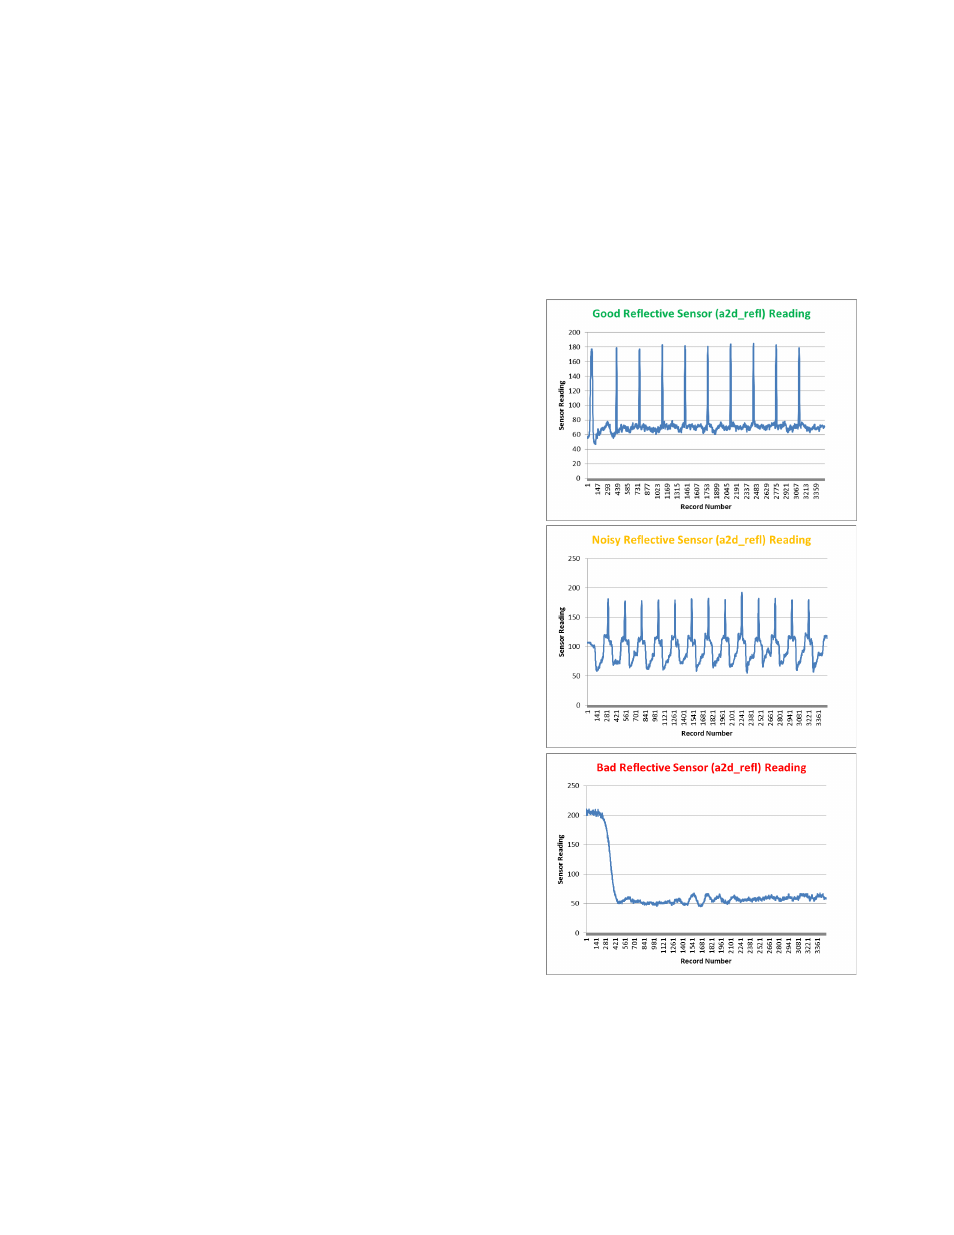
Interpreting the Gap/Mark Sensor Readings
Import the test result .csv file into MS
Excel (or any spreadsheet) using comma
as the delimiter from the Diagnostics tab
in the EWS. Column “a2d_refl” and
“a2d_st” reflects the gap (transmissive)
and mark (reflective) sensor readings
respectively.
Next, create a line graph using the
appropriate column of data.
There are 3 possible types of plot:
1. Normal - Sharp spikes at regular
intervals indicating the sensors can
clearly detect the gap or mark on the
media.
2. Noisy - Imperfect spikes at regular
intervals indicate the printer may be
erroneously detecting the
Top-of-Form. For more reliable
detection, reduce the sensitivity of the
appropriate sensor to achieve a plot
that is close to Normal.
3. Bad - Readings are not distinctive.
Increase the sensitivity of the appropriate sensor to achieve as close to a Normal
plot as possible. If the readings do not improve at maximum sensitivity, this indicates
that there is insufficient contrast between the gap (or mark) and the liner. In such a
case, the media is incompatible with the printer.