CIRCUTOR PowerStudio Series User Manual
Page 25
Advertising
PowerStudio
User Manual 25
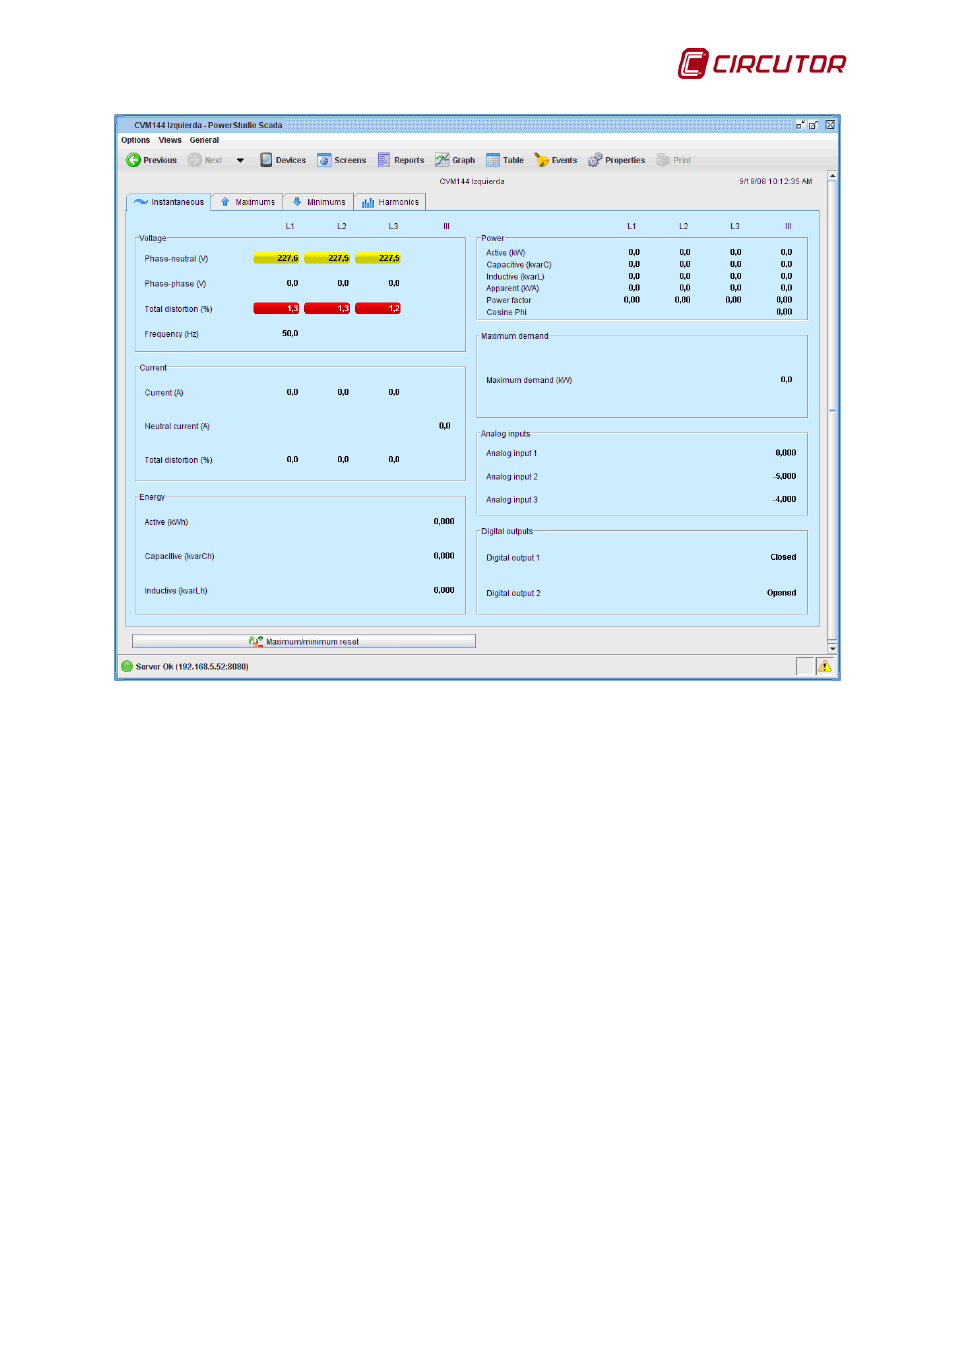
Device display screen (text view)
As can be seen on the previous screen, the various variable values are organized in tabs,
graphs, tables, rows and/or columns for easier location. Likewise, some of the selected variables can
be seen marked by white letters on a blue background. Another common element among the various
device overviews is that limits can be set on the variables values, so that they can be marked with one
color or another depending on the interval.
Advertising