CIRCUTOR PowerStudio Series User Manual
Page 49
Advertising
PowerStudio
User Manual 49
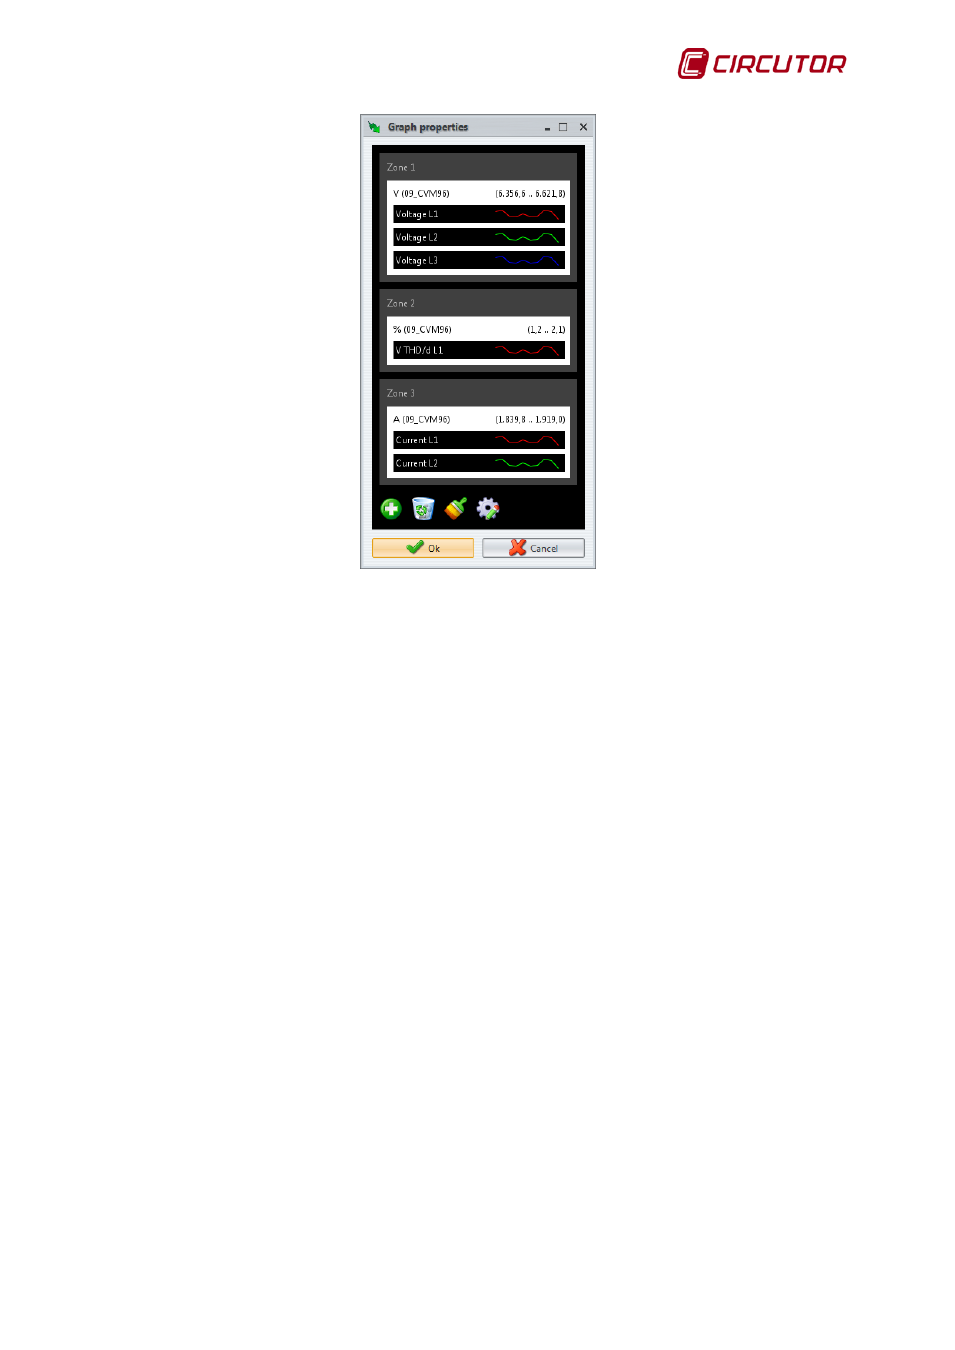
Graph properties window
This window allows the following changes to the graph:
• Modify the representation of each variable (lines, bars and points)
• Change the color of each variable.
• Modify the y-axis margins.
• Remove areas, axes and variables.
• Add areas, axes and variables.
• Change the distribution of areas, axes and variables.
• Edit the background and text colour.
• Change the title of the graphic.
As can be seen in the previous window a schematic representation of the variables and their
organization in areas and axes is shown. When the cursor is floated over this representation elements
can be modified (i.e. variables, axes and areas) will be highlighted.
Advertising