CIRCUTOR PowerStudio Series User Manual
Page 63
Advertising
PowerStudio
User Manual 63
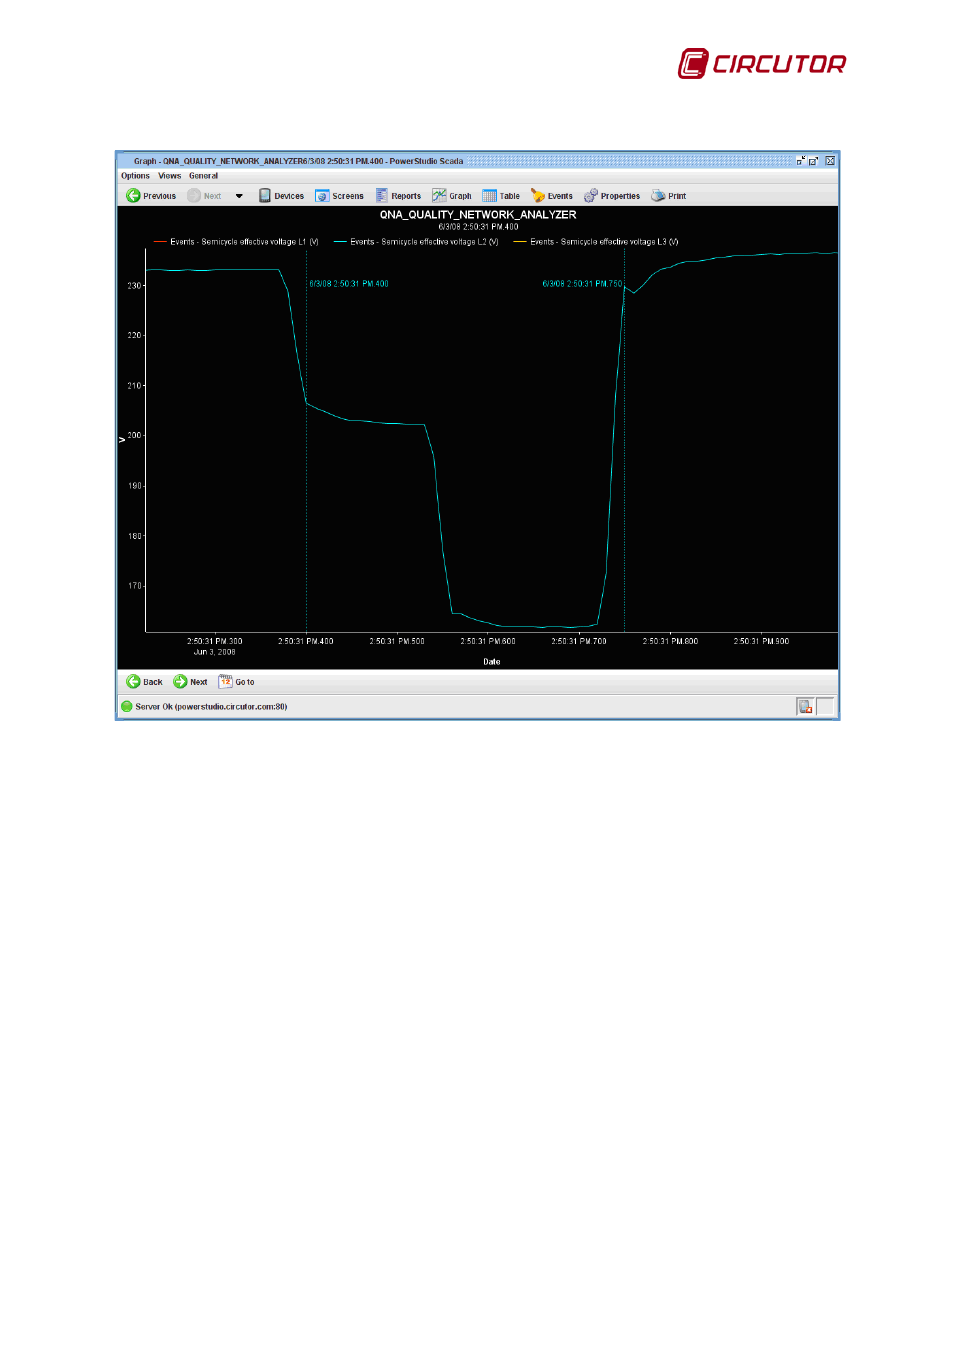
The last special type of graph is the semi-circular effective voltage graph.
Semi-circular effective voltage graph
This type of graph represents voltage evolution within a short space of time in semi-circular
intervals. These screenshots are made in response to an event capture at that moment.
Very similar to the waveform graph, the only difference being that the x-axis consists of dates
as in a standard graph, as the semi-cycle value capture takes place just at that moment.
Advertising