CIRCUTOR PowerStudio Series User Manual
Page 99
Advertising
PowerStudio
User Manual 99
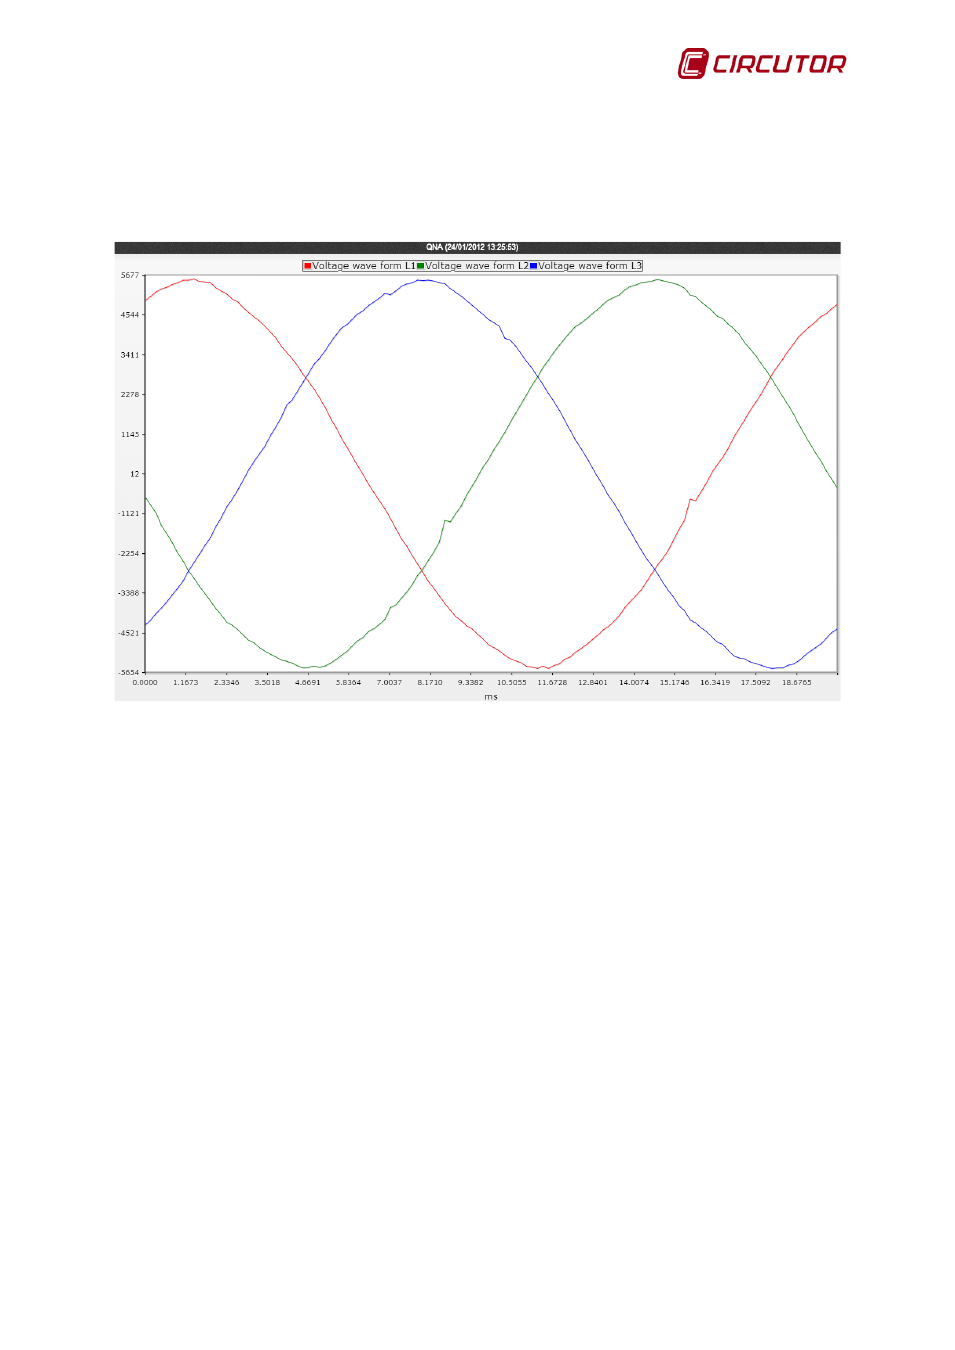
Another special feature graph is the waveform graph, generated by QNA equipment, which can
provide a screenshot of the voltage waveform as well as the current in each one of the phases.
The characteristics of this graph are very similar to the harmonics graph. The only differences are
that the X-axis units are milliseconds and that the representation is in lines by default. Only waveform
variables may be added to this type of graph.
QNA waveform graph
Advertising